
Figure 4. PA and PT scanning cytometry of platelet aggregates with different sizes placed into 120-μm-thick blood samples.
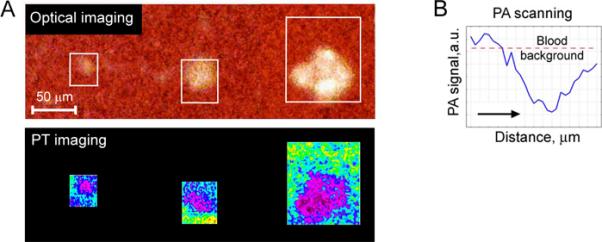
A. PT images (bottom row) and complementary optical images (top row) of platelet aggregates with the mean size of 22±1.7 μm (left), 38±3.1 μm (middle) and 68±4.9 μm (right). B. PA 2D-scan (averaging by 8 scans performed with steps of 10 μm) demonstrating a significant negative contrast from platelet aggregates with the size of 20 μm. Laser parameters: wavelength, 532 nm; pulse repetition frequency, 100 Hz; pulse energy, 1.0 μJ; diameter of laser spot, ~5 μm.