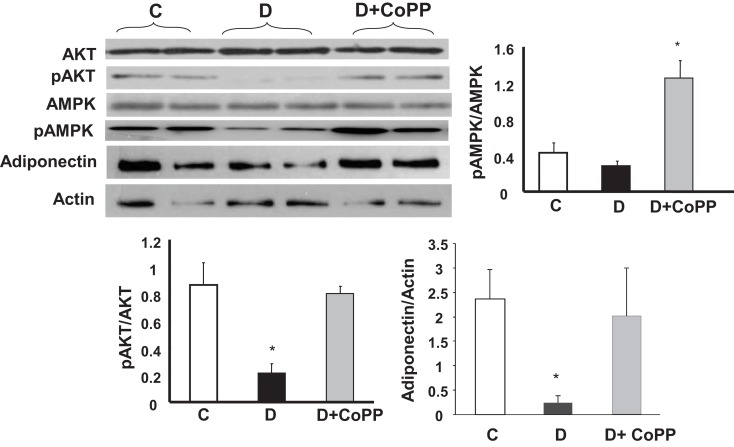
Figure 5.
Representative Western blot and densitometric analysis of cardiac expression of pAKt, Akt, pAMPK, AMPK, and adiponectin. Data are expressed as means ± SEM of three independent determinations of pAkt/Akt and pAMPK/AMPK ratios as well as of adiponectin/actin ratio. *p < 0.05 vs. other groups; #p < 0.01 vs. C.

