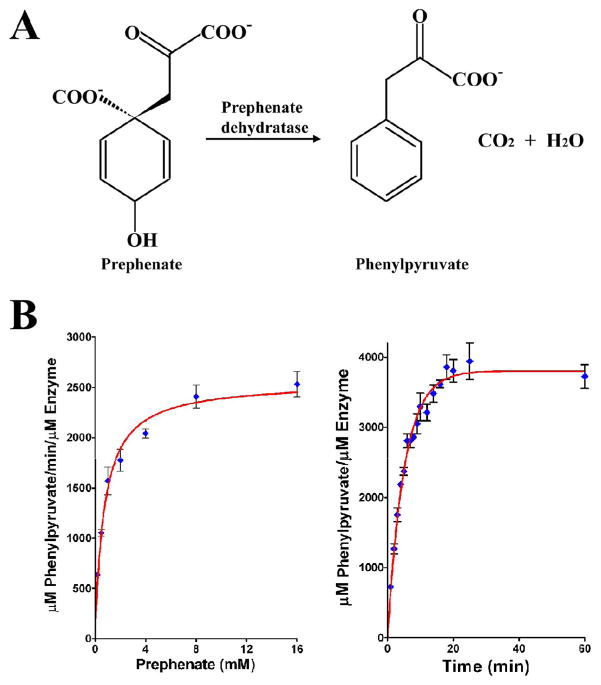
Figure 1.
The pathway and the enzymatic activity of Sa-PDT. (A) The conversion of prephenate to phenylpyruvate by prephenate dehydratase (PDT). (B) Activity assay for PDT was performed as described by Dopheide et al. (28) and as described in Materials and Methods. The left panel shows the reaction rate at different prephenate concentrations, the enzyme was 0.04 μM and the prephenate concentrations vary between 0.2 – 16 mM. The right panel shows the time course of the prephenate conversion to phenylpyruvate measured for 0.04 μM enzyme and 0.4 mM prephenate. The data were analyzed using the software PRISM. (Prizm Software, Irvine, CA).

