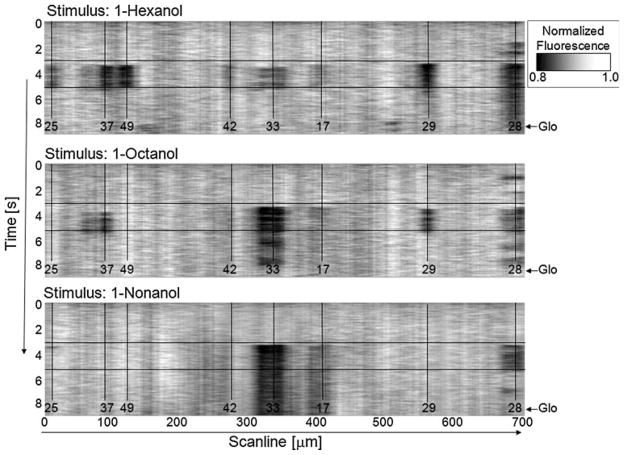
Fig. 6.
Calcium response maps for three different odours stimuli: a 1-hexanol, b 1-octanol, and c 1-nonanol, recorded along the scanning trace in Fig. 5b. The stimulus period is enclosed in horizontal lines, responding glomeruli centres are marked by vertical lines, numbers label the identified T1 glomeruli according to Galizia et al. (1999b) (reprinted from Haase et al. 2011, with permission from OSA)

