
FIGURE 1. HTS of sortase and cheminformatics.
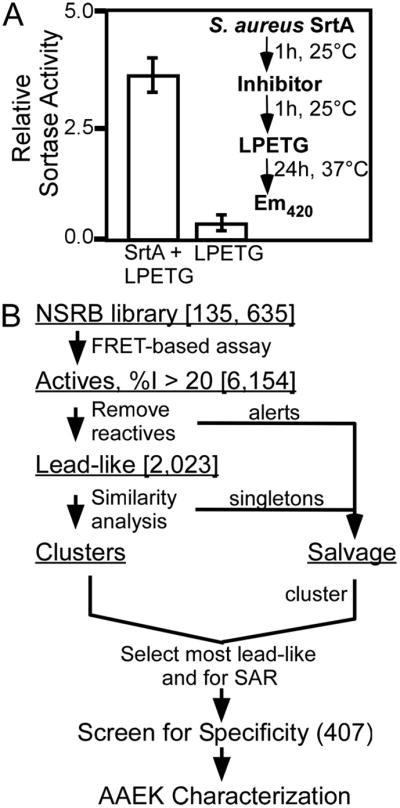
A, a fluorescence resonance energy transfer-based assay using a-LPETG-d as sortase substrate in a 384-well plate format was used in this HTS (Z′-factor of 0.94). The inset demonstrates the assay design used to identify sortase inhibitors. B, compounds displaying inhibition ≥20% of mean positive control (6,154) were computationally filtered to remove reactive inhibitors, promiscuous inhibitors, etc. (see “Experimental Procedures”). Filtered molecules were placed in a Salvage set, and remaining Lead-like actives were clustered and sampled based on lead-likeness and potential for later SAR analysis, with emphasis on the most active compounds. Approximately 210 “clean” compounds were selected from the Lead-like Clusters. To allow for discovery of chemical tools as well (54), these were combined with representatives from the Salvage set (after their re-clustering) to yield a final set of 407 compounds to take into the secondary screen for specificity.