Abstract
Insulin-degrading enzyme (IDE), a Zn2+-metalloprotease, is involved in the clearance of insulin and amyloid-β (refs 1–3). Loss-of-function mutations of IDE in rodents cause glucose intolerance and cerebral accumulation of amyloid-β, whereas enhanced IDE activity effectively reduces brain amyloid-β (refs 4–7). Here we report structures of human IDE in complex with four substrates (insulin B chain, amyloid-β peptide (1–40), amylin and glucagon). The amino- and carboxy-terminal domains of IDE (IDE-N and IDE-C, respectively) form an enclosed cage just large enough to encapsulate insulin. Extensive contacts between IDE-N and IDE-C keep the degradation chamber of IDE inaccessible to substrates. Repositioning of the IDE domains enables substrate access to the catalytic cavity. IDE uses size and charge distribution of the substrate-binding cavity selectively to entrap structurally diverse polypeptides. The enclosed substrate undergoes conformational changes to form β-sheets with two discrete regions of IDE for its degradation. Consistent with this model, mutations disrupting the contacts between IDE-N and IDE-C increase IDE catalytic activity 40-fold. The molecular basis for substrate recognition and allosteric regulation of IDE could aid in designing IDE-based therapies to control cerebral amyloid-β and blood sugar concentrations1,8,9.
Insulin-degrading enzyme (IDE), originally identified by its ability to rapidly degrade insulin, is a highly conserved Zn2+-metalloprotease found in bacteria, fungi, plants and animals10 (Supplementary Fig. 1). In budding yeast, IDE homologues have key roles in bud-site selection and mating11,12. IDE is unusual in its high affinity for substrates that are highly diverse in sequence and structure1 (Supplementary Fig. 2). Furthermore, IDE has a remarkable capacity to cleave selectively some hormones without degrading related family members1,2 (Supplementary Fig. 2). Despite this high affinity, IDE cleaves its substrates several times and the recognition motifs are not obvious from the cleavages sites. The molecular basis by which IDE shows high selectivity but degenerate cleavage sites for a broad range of hormones has so far remained elusive.
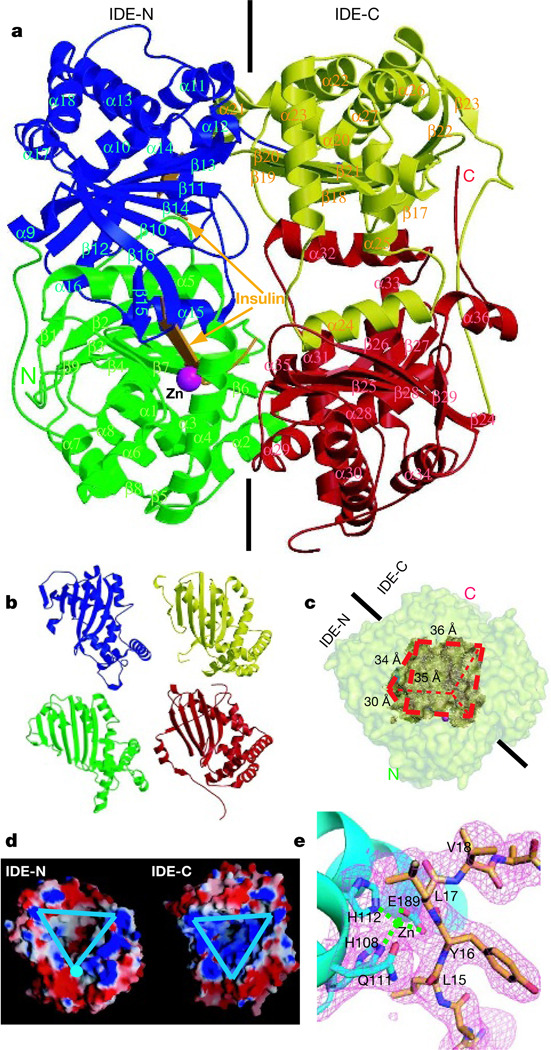
To understand the substrate recognition and catalytic mechanism of IDE, we solved crystal structures of the 113-kDa human, Zn2+-bound, catalytically inactive IDE mutant IDE-E111Q (ref. 13) in complex with insulin B chain at 2.25 Å resolution (Fig. 1a), and Zn2+-free IDE-E111Q in complex with amyloid-β peptide (Aβ (1–40)), amylin and glucagon at 2.1 Å, 2.6 Å and 2.5 Å resolution, respectively (Fig. 2). Each IDE monomer comprises four structurally homologous αβ roll domains (domain 1, residues 43–285; domain 2, residues 286–515; domain 3, residues 542–768; and domain 4, residues 769–1,016), which share less than 25% sequence similarity (Fig. 1b and Supplementary Figs 3 and 4). The N-terminal domains 1 and 2 form a αβαβα sandwich (IDE-N), as do domains 3 and 4 (IDE-C)14.
Figure 1. Overall structure of IDE-E111Q in complex with insulin B chain.
a, Secondary structure representation of the IDE-E111Q–insulin B chain complex. Domains 1, 2, 3 and 4 are coloured green, blue, yellow and red, respectively. Zn2+ and insulin B chain are coloured magenta and orange, respectively. b, Structure homology of the four domains of IDE. c, Surface representation of the substrate-binding chamber of IDE. The outer surface of IDE and the substrate chamber are coloured pale yellow and brown, respectively. d, Electrostatic surface representation of the IDE substrate-binding chamber. The inner substrate binding chambers of IDE-N and IDE-C are marked by triangles. The surface is coloured as follows: negative, red; positive, blue; neutral, white. e, Catalytic centre of IDE. The simulated annealing omit map (magenta) is contoured at 3.5σ. IDE and insulin B chain are coloured cyan and orange, respectively.
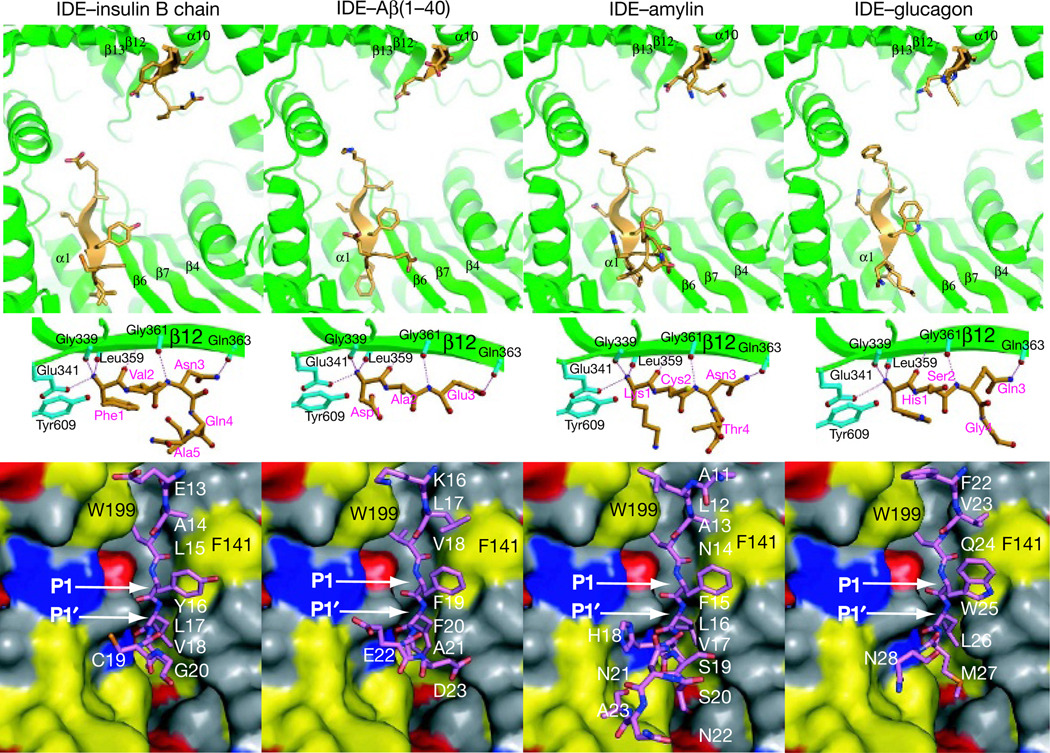
Figure 2. Interaction of IDE with its substrates.
Top, global view of how substrates bind to IDE. Middle, detailed interaction of the N terminus of substrates with IDE. Secondary structures and substrates of IDE are coloured green and orange, respectively. Bottom, interaction of the cleavage site of IDE substrates with the IDE catalytic cleft. The polar, hydrophobic, positive and negative surfaces are coloured grey, yellow, blue and red, respectively.
IDE-N and IDE-C are joined by a 28-residue extended loop and form an enclosed chamber, shaped like a triangular prism, with triangular base dimensions of 35×34×30 Å and a height of 36 Å. This enclosed cavity has a total volume of ~1.3×10⁴ Å3, which is just large enough to encapsulate insulin A and B chains (Fig. 1c and Supplementary Fig. 5). All four domains contribute surface to the internal chamber. The surface provided by IDE-N is largely neutral or negatively charged, whereas that provided by IDE-C is predominantly positively charged (Fig. 1d). IDE domain 1 contains the catalytic site with a Zn2+ ion coordinated by two histidines (residues 108 and 112) and one glutamate (residue 189; ref. 15 and Fig. 1a, e). In our IDE structures, the general base glutamate 111 is replaced with glutamine to prevent the catalysis of substrates13.
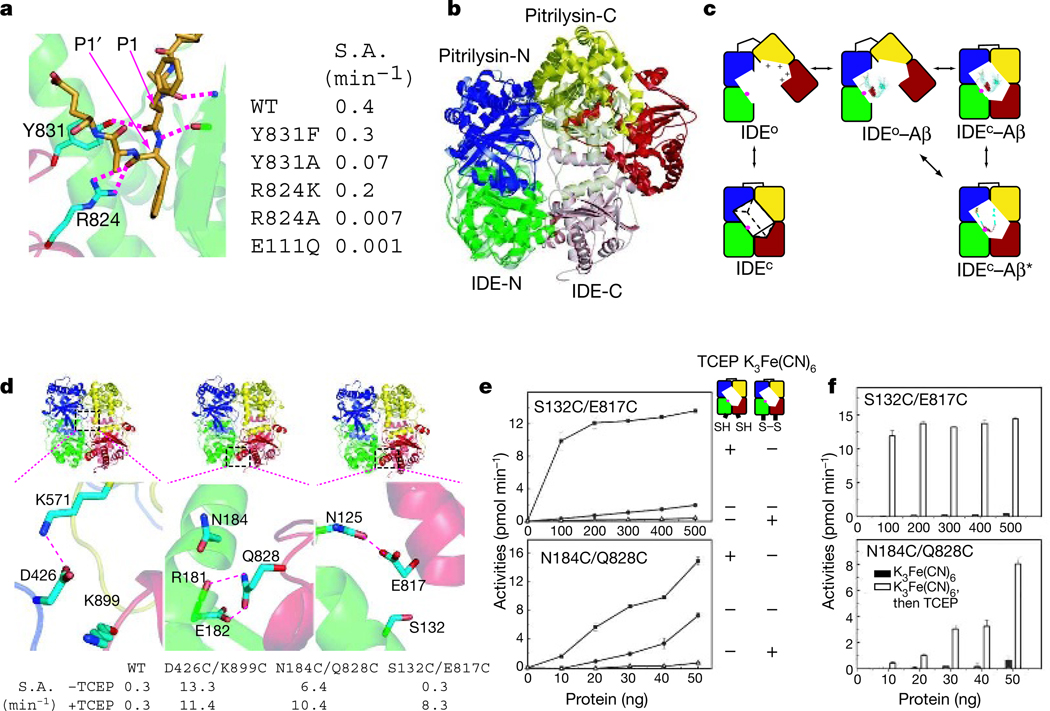
Two discrete segments of four sequence diverse substrates—insulin B chain, the amyloid-β peptide (Aβ(1–40)), amylin and glucagon—are clearly visible in structures of the IDE–substrate complex, and they share similar features (Fig. 2 and Supplementary Fig. 6). The N-terminal 3–5 amino acids and cleavage-site-containing 7–13 amino acids of all four substrates form β-sheets with IDE strands β12 and β6, respectively (Fig. 2). The remaining regions (55–72%) of all four substrates in our IDE–substrate complexes are disordered, even though they are present in the chamber, as verified by mass spectrometry analysis (Supplementary Fig. 7). At the catalytic site, several residues of IDE domains 1 and 4 form a largely polar cavity with patches of hydrophobic and charged regions that interact with cleavage sites in all four substrates (Fig. 2 and Supplementary Fig. 8). The bulky hydrophobic residues at the P1 residues of the IDE substrates interact with Phe 141 at the S1 subsite of IDE domain 1, whereas the hydrophobic residues of the P1′ residues are buried deeply in the hydrophobic patch surrounding the S1′ subsite of IDE domain 1. In addition, Arg 824 and Tyr 831 of IDE domain 4 form hydrogen bonds with the P1 and P1′ residues of substrates. Mutations of these two residues to alanine substantially reduce the catalytic rate of IDE (Fig. 3a and Supplementary Fig. 9). This is consistent with the idea that IDE-N functions as the catalytic domain, whereas IDE-C facilitates the binding of substrates14.
Figure 3. Conformational switch of IDE.
a, Details of the interaction with Aβ(1–40), showing residues Tyr 831 and Arg 824 from domain 4 of IDE and the specific activity (S.A.) of IDE mutants. Domains 1 and 4 of IDE are coloured green and red, respectively, and Aβ(1–40) is coloured orange. b, Structural comparison of IDE with pitrilysin. Pitrilysin is shown in solid colours and IDE in transparent colours. The colour scheme is the same as Fig. 1a. Domains 1 and 2 of IDE and pitrilysin are superimposed. c, Model of how IDE binds to its substrate. IDE has two conformational states: the open state, IDEo; and the closed state, IDEc. d, Details of the interactions of residues between IDE-N and IDE-C at three discrete locations and the catalytic activities of three IDE double cysteine mutants in the presence or absence of TCEP. e, Activities of two double cysteine mutants in the presence of TCEP or K3Fe(CN)6. f, Rescue of S132C/E817C and N184C/Q828C by TCEP. Results in e and f are the mean±s.e.m.
The enclosed substrate-binding compartment of IDE prevents the entry and exit of substrates. Thus, IDE needs to undergo a significant conformational change from the open state, which can accept substrate, to the closed state for proper substrate recognition and catalysis. The structural comparison of substrate-bound IDE with substrate-free Escherichia coli pitrilysin (PDB accession code 1Q2L) reveals how repositioning between IDE-N and IDE-C can lead to the open state, which allows substrate to access the catalytic cavity16 (Fig. 3b and Supplementary Fig. 10). Pitrilysin shares 25% sequence identity with IDE and is arranged as two globular entities, pitrilysin-N and pitrilysin-C (Fig. 3b). Structural comparison of pitrilysin and IDE reveals that pitrilysin-C rotates 54° away from pitrilysin-N such that domain 4 of pitrilysin does not contact domain 1. Thus, IDE may normally equilibrate between the substrate-free open state (IDEo) and the closed state (IDEc; Fig. 3c). IDEc cannot bind substrates, but it is capable of degrading substrate after substrates are entrapped inside the catalytic chamber. IDEo can bind substrates; however, without the contribution of residues from IDE-C (Arg 824 and Tyr 831 of domain 4), IDEo is less active than IDEc (ref. 14). After the transition from IDEo to IDEc, the entrapped peptides need to fit into the catalytic cleft of IDE to enable their cleavage once or multiple times before the reopening of IDE.
IDE-N and IDE-C have extensive interactions that bury a large surface (11,496 Å2) with good shape complementarity17 (shape complementarity score=0.66) and numerous hydrogen bonds (Supplementary Fig. 4e). This leads to the prediction that, in the absence of interactions with other proteins or factors, the substrate-free IDEc state is stable and the catalytic chamber of IDE is mostly closed. To test this hypothesis, we constructed three IDE mutants carrying double cysteine mutations that could loosen the contacts between IDE-N and IDE-C, therefore promoting opening of the catalytic chamber and increasing the catalytic rate (Fig. 3d). The two cysteine mutations are also designed to form a potential disulphide bond; thus, these mutants could be locked in the closed conformation18. When fluorogenic substrate V was used as a substrate, all three IDE mutants—D426C/K899C, N184C/Q828C and S132C/E817C—had 30–40-fold higher catalytic activity than did wild-type IDE in the presence of the reducing agent Tris-(2-carboxyethyl)-phosphine (TCEP; Fig. 3d). The increased proteolytic activities of these three IDE mutants were confirmed when either insulin or the amyloid-β peptide (1–42) were used (Supplementary Fig. 11). We then tested whether these IDE mutants could be inactivated in the presence of the oxidizing agent K3Fe(CN)6, which facilitates disulphide bond formation. We found that S132C/E817C and N184C/Q828C were mostly inactive in the presence of K3Fe(CN)6 (Fig. 3e, f, and Supplementary Fig. 9). The activities of these two mutants were restored when TCEP was added (Fig. 3f). The third pair, D426C/K899C, was not inactivated by K3Fe(CN)6, presumably owing to the lack of the formation of a disulphide bond. As a control, wild-type IDE was insensitive to the treatment of TCEP or K3Fe(CN)6 (Fig. 3d and Supplementary Fig. 9). The oligomeric state of these three IDE mutants is similar to that of wild-type IDE, excluding the idea that a difference in oligomerization is the cause of their hyperactivity19 (Supplementary Fig. 12).
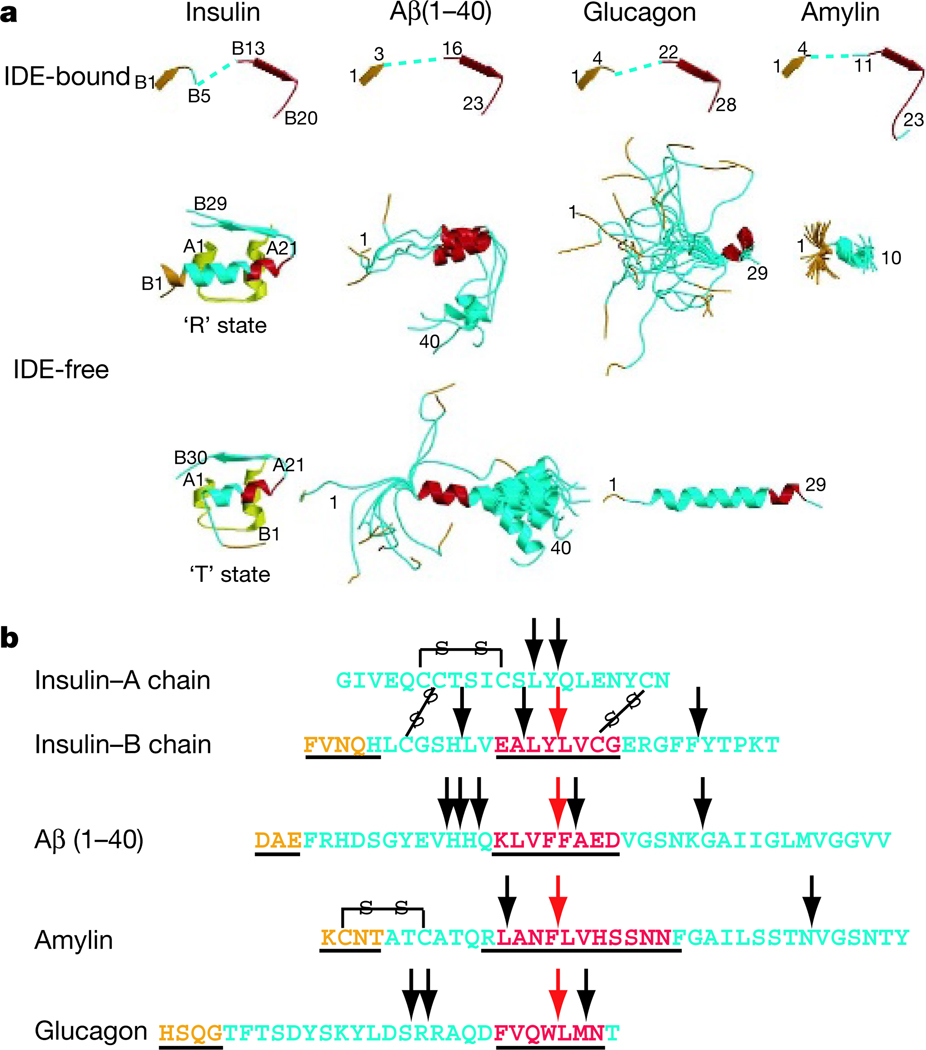
The comparison of IDE-free and IDE-bound insulin B chain, Aβ(1–40), amylin and glucagon reveals substantial conformational changes in IDE substrates on binding to IDE20–25 (Fig. 4a). Both the N-terminal loop and the α-helical cleavage site turn into β-strands. IDE cleaves insulin B chain and amyloid-β at several sites1,26. The binding of insulin B chain and Aβ(1–40) to the IDE catalytic cleft positions both substrates for cleavage at known sites (Fig. 4b). IDE also cleaves amylin and glucagon at several locations, but these sites had not previously been identified. Our matrix-assisted laser desorption–ionization time-of-flight analysis verified that the cleavage sites for amylin and glucagon do indeed correspond to degradation sites shown by the crystal structures of the IDE–substrate complex (Fig. 4b and Supplementary Fig. 13).
Figure 4. Conformational changes and catalysis of IDE substrates.
a, Secondary structure of IDE substrates in the IDE-bound (top) or free (bottom) form. The N terminus and IDE catalytic cleft binding segment are coloured orange and red, respectively. The PDB accession codes for insulin are 1G7A and 1ZEH, those for Aβ are 1AML and 1BA4, those for glucagon are 1GCN and 1KX6, and that for amylin is 1KUW. b, Sequence comparison of four IDE substrates. Arrows indicate the main cleavage sites of the substrate by IDE1,26 (Supplementary Fig. 13). Amino acids that are underlined are observed in the crystal structures of substrate-bound IDE.
Together, our structural and biochemical analyses reveal that at least four factors contribute to the unique mechanism of substrate recognition by IDE. Favourable binding of the substrate N terminus and cleavage sites to β-strands within IDE and proper anchoring of the cleavage site in the catalytic cleft are clearly key specific determinants. In addition, peptides that do not have significant positive charges at the C terminus and avoid the charge repulsion from IDE-C are better IDE substrates. Our IDE–substrate structures show that the C termini of insulin B chain, amyloid-β and amylin make substantial contacts with the IDE inner cavity, which is highly positively charged (Fig. 1d). Brain natriuretic peptide, glucagon-like peptide and insulin growth factor I (IGF-I), which have many positively charged residues at their C termini, are poor substrates (Supplementary Fig. 2). By contrast, the related hormones atrial natriuretic peptide, glucagon and IGF-II, which lack positive charges at their C termini, are excellent IDE substrates. The fourth determining factor is size. The catalytic chamber of IDE is large enough to accommodate only relatively small peptides (estimated to be <50 amino acids). Larger peptides such as transforming growth factor-β (TGF-β) and pro-insulin are less likely to be entrapped by IDE than the related, smaller hormones, TGF-α and insulin. Consequently, the degradation of such larger peptides is considerably slower1 (Supplementary Fig. 2).
IDE has a unique regulatory mechanism. As an M16A member of the Zn2+-metalloprotease family, it shares similar secondary structure and domain organization with yeast mitochondria processing peptidase (MPP), a distally related M16B member27 (Supplementary Fig. 10). Similar to IDE, MPP also uses the exosite for substrate recognition16,27,28. The catalytic chamber of MPP stays open, however, whereas IDE has a buried catalytic site in the structure and access to this chamber is kinetically controlled by the closed–open conformational switch. IDE can also self-oligomerize and the interaction between two IDE dimers could lock IDE in the IDEc state (Supplementary Fig. 14). This might explain how oligomerization allosterically regulates the catalytic activity of IDE19. Small molecules that could shift the equilibrium between IDEc and IDEo towards the open state or reduce IDE oligomerization will probably allosterically regulate the activity of IDE. Such compounds might facilitate the clearance of amyloid-β and other pathologically relevant IDE substrates.
METHODS
Protein preparation and crystallization
We purchased human insulin (RayBiotech), Aβ(1–40) (Biosource), amylin (Bachem) and glucagon (Anaspec). Human IDE-E111Q and selenomethionyl-IDE-E111Q were expressed in E. coli strains Rosetta(DE3) and B834(DE3)pUBS520, respectively, at 25 °C by IPTG induction for 19 h, and purified by Ni2+-NTA, source-Q and Superdex S-200 columns. Preformed IDE–substrate complexes isolated from S-200 columns (~15 mg ml−1 in 20 mM Tris-HCl and 50 mM NaCl; pH8.0) in the presence of a reducing agent, 1 mM TCEP, were mixed with equal volumes of reservoir solution containing 0.1 M HEPES (pH 7.0), 12% (w/v) PEGMME-5000, 5% tacsimate and 10% dioxane. Crystals appeared after 1–3 weeks at 18 °C and were then equilibrated in cryo-protective buffer containing well buffer and 30% glycerol. IDE–substrate complex crystals belong to the space group P65, with unit-cell dimensions a=b=262 Å and c=90 Å, and contain a dimeric IDE–substrate complex per asymmetric unit.
Structure determination
Data were collected at 14-BM-C and 19-ID stations in the Advanced Photon Source at Argonne National Laboratory and processed with HKL2000. Anomalous diffraction data were collected on crystals of the selenomethionyl-IDE–insulin-B-chain complex, and 34 out of 52 selenium sites were located by the Shake-and-Bake program. Initial phases were obtained by SAD using SHARP29. DM programs and phase extension were done on the Zn2+-bound IDE–insulin-B-chain complex (Supplementary Table 1 and Fig. 15). AMoRe was used to obtain the initial phases of structures of Zn2+-free IDE in complex with insulin B chain, Aβ, amylin and glucagon by using the IDE–insulin B chain complex as a template. Model building and refinement of IDE-substrate complexes were done with COOT and CNS30. The final structures of Zn2+-IDE–insulin-B-chain, Zn2+-free IDE–insulin-B-chain, IDE–Aβ, IDE–amylin and IDE–glucagon have an Rfree value of 23.3%, 22.5%, 22.3%, 22.5% and 22.5%, and an Rcryst value of 20.6%, 20.5%, 20.3%, 19.6% and 19.8%, respectively. Detailed data collection and refinement statistics are summarized in Supplementary Table 2. The electron density of the whole IDE dimer (residues 43–1,016) is clearly visible, except for a short disordered loop (residues 974–976) and the C-terminal end (residues 1,017–1,018). Only the structure of the Zn2+-bound IDE–insulin-B-chain complex is discussed because the structure of the Zn2+-free IDE–insulin-B-chain complex has less clear electron density for the side chains of insulin B chain at the catalytic cleft (Supplementary Fig. 6) and crystals of the complex between IDE and intact insulin did not diffract well (Supplementary Fig. 16).
Enzymatic assay
IDE mutants were constructed with a Quik-Change kit (Biocrest Manufacturing) and purified by Ni2+-NTA and source-Q columns. Enzyme activities were assayed by mixing 100 µl of 5 µM fluorogenic peptide substrate V (R&D Systems) in 50 mM potassium phosphate (pH 7.3) and 5 µl of IDE proteins at 37 °C at the indicated time and by monitoring fluorescence intensity on a Tecan Safire2 microplate reader at an excitation wavelength of 327 nm and an emission wavelength of 395 nm (ref. 14). To measure the activities of two double cysteine mutants in the presence of TCEP or K3Fe(CN)6, the indicated quantities of S132C/E817C and N184C/Q828C were pre-incubated with 1 mM TCEP or 1 mM K3Fe(CN)6 at room temperature for 10 and 60 min, respectively, to carry out reducing or oxidizing reactions. The fluorogenic substrate was then added and incubated at 37 °C for 30 min. To perform the rescue experiment of S132C/E817C and N184C/Q828C by TCEP, the activities of these two mutants in the presence of 1 mM K3Fe(CN)6 were first measured after a 30-min incubation. TCEP was then added to a concentration of 5 mM and the activities were measured after 30 or 60 min for S132C/E817C or N184C/Q828C, respectively.
Supplementary Material
Acknowledgements
We thank the staff of APS SBC 19-ID and Biocars 14-BM-C, P. Li and Q. Guo for help with data collection; M. Manolopoulou for help with protein purification; H. Im for help with IDE enzymatic assays; D. Wolfgeher for help with mass spectrometry; E. Johnson for providing the synthetic Aβ(1–42) peptide; and R. Bourdeau for critically reading the manuscript. This research was supported by NIH and The University of Chicago Diabetes Center grants to W.T.
Footnotes
Supplementary Information is linked to the online version of the paper at www.nature.com/nature.
Author Contributions W.T. designed the experiments and Y.S. conducted all experiments. W.T. and Y.S. analysed the results and co-wrote the paper. All authors discussed the results and commented on the manuscript.
Author Information Coordinates of the X-ray structures of the substrate-bound IDE have been deposited in the RCSB Protein Data Bank under accession code 2G54 (Zn2+-IDE–insulin-B-chain), 2G56 (Zn2+-free IDE–insulin-B-chain), 2G47 (IDE–Aβ(1–40)), 2G48 (IDE–amylin) and 2G49 (IDE–glucagon).
The authors declare no competing financial interests.
References
- 1.Duckworth WC, Bennett RG, Hamel FG. Insulin degradation: progress and potential. Endocr. Rev. 1998;19:608–624. doi: 10.1210/edrv.19.5.0349. [DOI] [PubMed] [Google Scholar]
- 2.Kurochkin IV. Insulin-degrading enzyme: embarking on amyloid destruction. Trends Biochem. Sci. 2001;26:421–425. doi: 10.1016/s0968-0004(01)01876-x. [DOI] [PubMed] [Google Scholar]
- 3.Bennett RG, Duckworth WC, Hamel FG. Degradation of amylin by insulin-degrading enzyme. J. Biol. Chem. 2000;275:36621–36625. doi: 10.1074/jbc.M006170200. [DOI] [PubMed] [Google Scholar]
- 4.Farris W, et al. Insulin-degrading enzyme regulates the levels of insulin, amyloid β-protein, and the β-amyloid precursor protein intracellular domain in vivo. Proc. Natl Acad. Sci. USA. 2003;100:4162–4167. doi: 10.1073/pnas.0230450100. [DOI] [PMC free article] [PubMed] [Google Scholar]
- 5.Farris W, et al. Partial loss-of-function mutations in insulin-degrading enzyme that induce diabetes also impair degradation of amyloid β-protein. Am. J. Pathol. 2004;164:1425–1434. doi: 10.1016/s0002-9440(10)63229-4. [DOI] [PMC free article] [PubMed] [Google Scholar]
- 6.Leissring MA, et al. Enhanced proteolysis of β-amyloid in APP transgenic mice prevents plaque formation, secondary pathology, and premature death. Neuron. 2003;40:1087–1093. doi: 10.1016/s0896-6273(03)00787-6. [DOI] [PubMed] [Google Scholar]
- 7.Miller BC, et al. Amyloid-β peptide levels in brain are inversely correlated with insulin activity levels in vivo. Proc. Natl Acad. Sci. USA. 2003;100:6221–6226. doi: 10.1073/pnas.1031520100. [DOI] [PMC free article] [PubMed] [Google Scholar]
- 8.Selkoe DJ. Clearing the brain’s amyloid cobwebs. Neuron. 2001;32:177–180. doi: 10.1016/s0896-6273(01)00475-5. [DOI] [PubMed] [Google Scholar]
- 9.Tanzi RE, Bertram L. Twenty years of the Alzheimer’s disease amyloid hypothesis: a genetic perspective. Cell. 2005;120:545–555. doi: 10.1016/j.cell.2005.02.008. [DOI] [PubMed] [Google Scholar]
- 10.Mirsky IA, Broth-Kahn RH. The inactivation of insulin by tissue extracts. I. The distribution and properties of insulin inactivating extracts (insulinase) Arch. Biochem. 1949;20:1–9. [PubMed] [Google Scholar]
- 11.Adames N, Blundell K, Ashby MN, Boone C. Role of yeast insulin-degrading enzyme homologs in propheromone processing and bud site selection. Science. 1995;270:464–467. doi: 10.1126/science.270.5235.464. [DOI] [PubMed] [Google Scholar]
- 12.Fujita A, et al. A yeast gene necessary for bud-site selection encodes a protein similar to insulin-degrading enzymes. Nature. 1994;372:567–570. doi: 10.1038/372567a0. [DOI] [PubMed] [Google Scholar]
- 13.Perlman RK, Rosner MR. Identification of zinc ligands of the insulin-degrading enzyme. J. Biol. Chem. 1994;269:33140–33145. [PubMed] [Google Scholar]
- 14.Li P, Kuo W-L, Yousef M, Rosner MR, Tang W-J. The C-terminal domain of human insulin degrading enzyme is required for the dimerization and substrate recognition. Biochem. Biophys. Res. Commun. 2006;343:1032–1037. doi: 10.1016/j.bbrc.2006.03.083. [DOI] [PubMed] [Google Scholar]
- 15.Becker AB, Roth RA. An unusual active site identified in a family of zinc metalloendopeptidases. Proc. Natl Acad. Sci. USA. 1992;89:3835–3839. doi: 10.1073/pnas.89.9.3835. [DOI] [PMC free article] [PubMed] [Google Scholar]
- 16.Maskos K. In: Handbook of Metalloproteins. Messerschmidt A, Dode W, Cygler M, editors. John Wiley & Sons; 2004. pp. 190–198. [Google Scholar]
- 17.Lawrence MC, Colman PM. Shape complementarity at protein/protein interfaces. J. Mol. Biol. 1993;234:946–950. doi: 10.1006/jmbi.1993.1648. [DOI] [PubMed] [Google Scholar]
- 18.Dombkowski AA. Disulfide by Design: a computational method for the rational design of disulfide bonds in proteins. Bioinformatics. 2003;19:1852–1853. doi: 10.1093/bioinformatics/btg231. [DOI] [PubMed] [Google Scholar]
- 19.Song ES, Juliano MA, Juliano L, Hersh LB. Substrate activation of insulin-degrading enzyme (insulysin). A potential target for drug development. J. Biol. Chem. 2003;278:49789–49794. doi: 10.1074/jbc.M308983200. [DOI] [PubMed] [Google Scholar]
- 20.Chothia C, Lesk AM, Dodson GG, Hodgkin DC. Transmission of conformational change in insulin. Nature. 1983;302:500–505. doi: 10.1038/302500a0. [DOI] [PubMed] [Google Scholar]
- 21.Sasaki K, Dockerill S, Adamiak DA, Tickle IJ, Blundell T. X-ray analysis of glucagon and its relationship to receptor binding. Nature. 1975;257:751–757. doi: 10.1038/257751a0. [DOI] [PubMed] [Google Scholar]
- 22.Braun W, Wider G, Lee KH, Wuthrich K. Conformation of glucagon in a lipid–water interphase by 1H nuclear magnetic resonance. J. Mol. Biol. 1983;169:921–948. doi: 10.1016/s0022-2836(83)80143-0. [DOI] [PubMed] [Google Scholar]
- 23.Coles M, Bicknell W, Watson AA, Fairlie DP, Craik DJ. Solution structure of amyloid β-peptide(1–40) in a water–micelle environment. Is the membrane-spanning domain where we think it is? Biochemistry. 1998;37:11064–11077. doi: 10.1021/bi972979f. [DOI] [PubMed] [Google Scholar]
- 24.Mascioni A, Porcelli F, Ilangovan U, Ramamoorthy A, Veglia G. Conformational preferences of the amylin nucleation site in SDS micelles: an NMR study. Biopolymers. 2003;69:29–41. doi: 10.1002/bip.10305. [DOI] [PubMed] [Google Scholar]
- 25.Sticht H, et al. Structure of amyloid A4-(1–40)-peptide of Alzheimer’s disease. Eur. J. Biochem. 1995;233:293–298. doi: 10.1111/j.1432-1033.1995.293_1.x. [DOI] [PubMed] [Google Scholar]
- 26.Leissring MA, et al. Kinetics of amyloid β-protein degradation determined by novel fluorescence- and fluorescence polarization-based assays. J. Biol. Chem. 2003;278:37314–37320. doi: 10.1074/jbc.M305627200. [DOI] [PubMed] [Google Scholar]
- 27.Taylor AB, et al. Crystal structures of mitochondrial processing peptidase reveal the mode for specific cleavage of import signal sequences. Structure. 2001;9:615–625. doi: 10.1016/s0969-2126(01)00621-9. [DOI] [PubMed] [Google Scholar]
- 28.Luciano P, Geli V. The mitochondrial processing peptidase: function and specificity. Experientia. 1996;52:1077–1082. doi: 10.1007/BF01952105. [DOI] [PubMed] [Google Scholar]
- 29.La Fortelle E, Bricogne G. Maximum-likelihood heavy-atom parameter refinement in the MIR and MAD methods. Methods Enzymol. 1997;276:472–494. doi: 10.1016/S0076-6879(97)76073-7. [DOI] [PubMed] [Google Scholar]
- 30.Emsley P, Cowtan K. Coot: model-building tools for molecular graphics. Acta Crystallogr. D. 2004;60:2126–2132. doi: 10.1107/S0907444904019158. [DOI] [PubMed] [Google Scholar]
Associated Data
This section collects any data citations, data availability statements, or supplementary materials included in this article.


