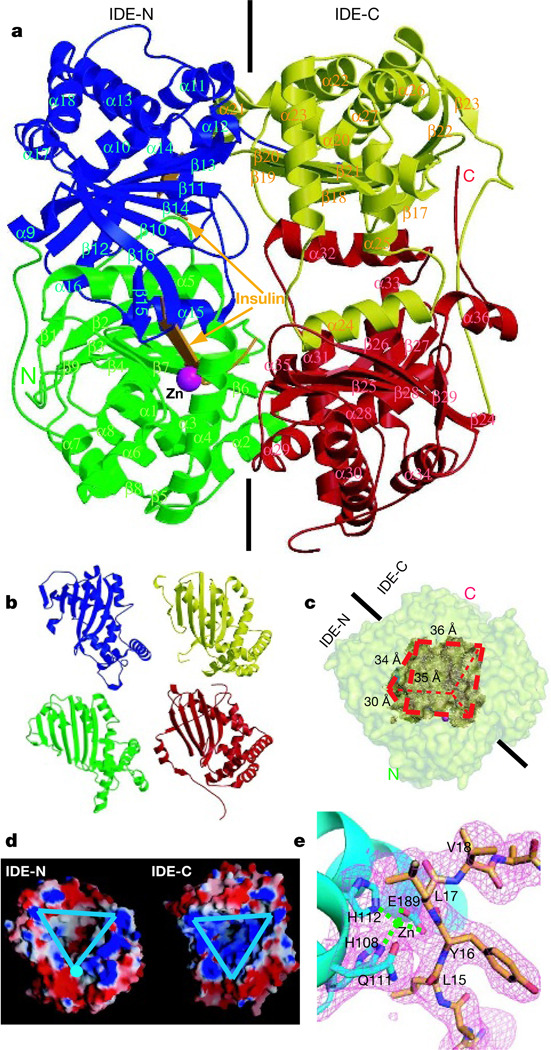
Figure 1. Overall structure of IDE-E111Q in complex with insulin B chain.
a, Secondary structure representation of the IDE-E111Q–insulin B chain complex. Domains 1, 2, 3 and 4 are coloured green, blue, yellow and red, respectively. Zn2+ and insulin B chain are coloured magenta and orange, respectively. b, Structure homology of the four domains of IDE. c, Surface representation of the substrate-binding chamber of IDE. The outer surface of IDE and the substrate chamber are coloured pale yellow and brown, respectively. d, Electrostatic surface representation of the IDE substrate-binding chamber. The inner substrate binding chambers of IDE-N and IDE-C are marked by triangles. The surface is coloured as follows: negative, red; positive, blue; neutral, white. e, Catalytic centre of IDE. The simulated annealing omit map (magenta) is contoured at 3.5σ. IDE and insulin B chain are coloured cyan and orange, respectively.

