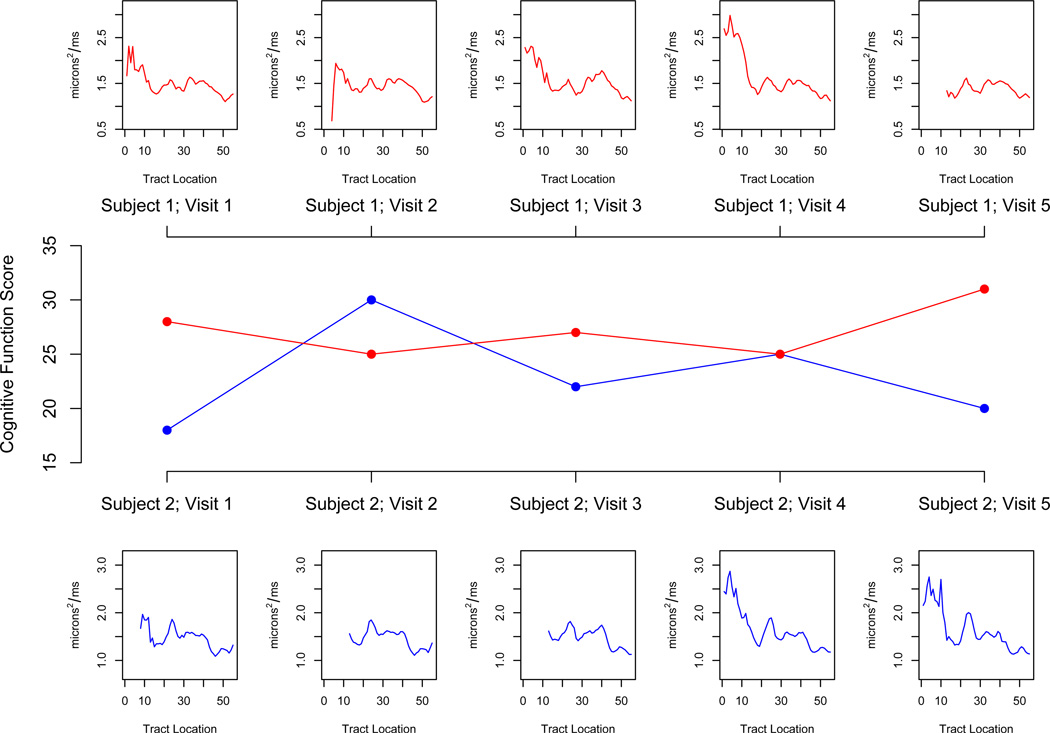
Figure 1.
Structure of the data. The center panel displays the scalar PASAT-3 cognitive disability measure for two subjects over five visits (measured as the number of questions answered correctly out of sixty); above and below are the parallel diffusivity tract profiles of the right corticospinal tract corresponding to each subject-visit outcome, which we use as a functional regressor.

