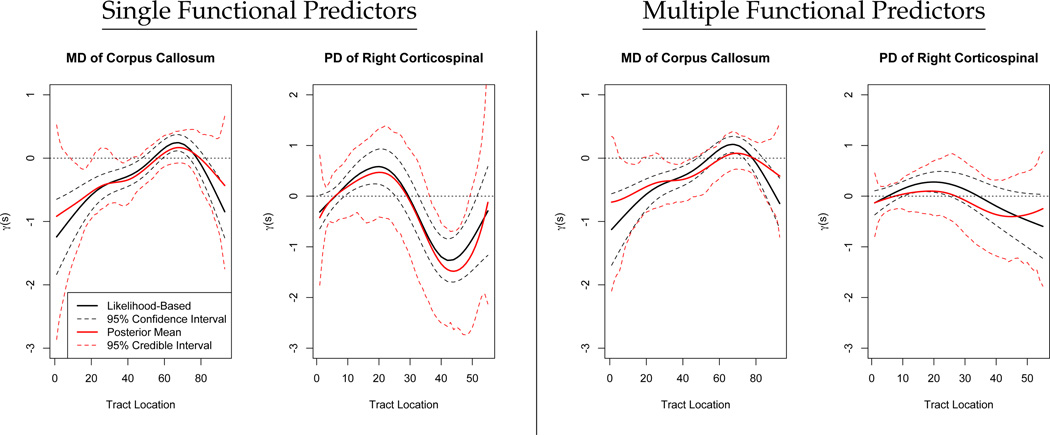
Figure 4.
Results of analyses with single and multiple functional predictors. On the left, we show the estimated coefficient function the mean diffusivity (MD) profile of the corpus callosum and the parallel diffusivity (PD) profile of the right corticospinal tract treated separately as single functional predictors. On the right we show the results of an analysis including both profiles as functional predictors. In all panels, solid lines depict estimated coefficient functions and dashed lines represent confidence intervals, while black curves are likelihood-based and red are Bayesian.

