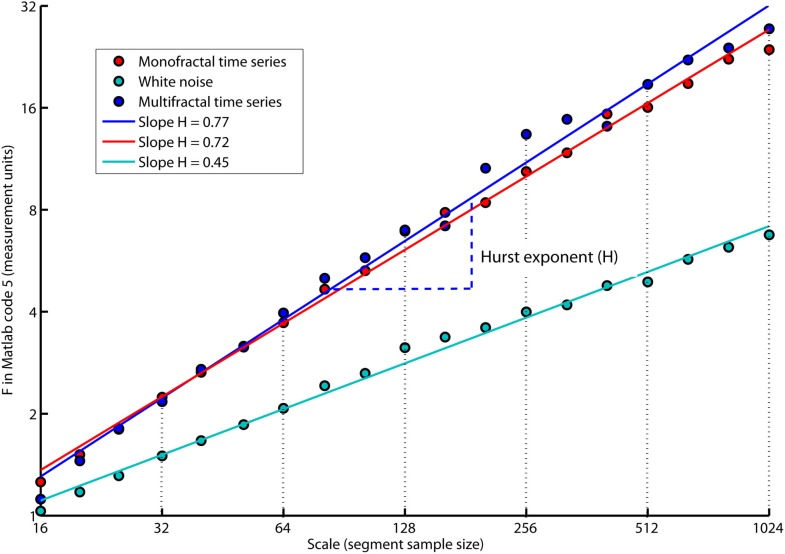
Figure 5.
The plot of overall RMS (i.e., F in Matlab code 5) versus the segment sample size (i.e., scale in Matlab code 5) where both F and scale are represented in log-coordinates. The scale invariant relation is indicated by the slope, H, of the regression lines, RegLine, computed by Matlab code 6. The slope, H, is a power law exponent called the Hurst exponent because F and scale are represented in log-coordinates. Notice that both the monofractal and multifractal time series have more apparent slow fluctuations compared to whitenoise indicated by larger amplitudes of the overall RMS on the larger scales.

