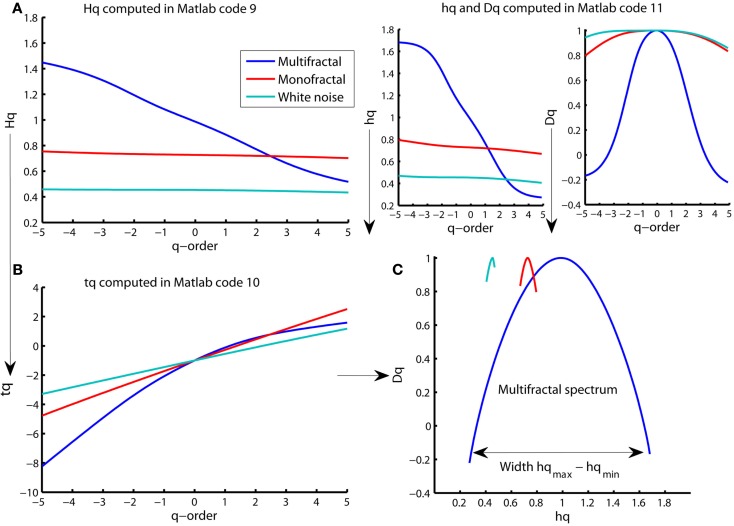
Figure 9.
Multiple representations of multifractal spectrum for multifractal (blue traces), monofractal (red traces), and whitenoise (turquoise trace) time series. (A) q-order Hurst exponent Hq computed in Matlab code 9. (B) Mass exponent tq computed in Matlab code 10. (C) Multifractal spectrum of Dq and hq (upper right panels) computed in Matlab code 11 and plotted against each other. The arrow indicates the difference between the maximum and minimum hq that are called the multifractal spectrum width. Notice that the constant Hq for monofractal and whitenoise times series leads to a linear tq that further leads to a constant hq and Dq that, finally, are joined to become only tiny arcs in (C).

