
Figure 6.
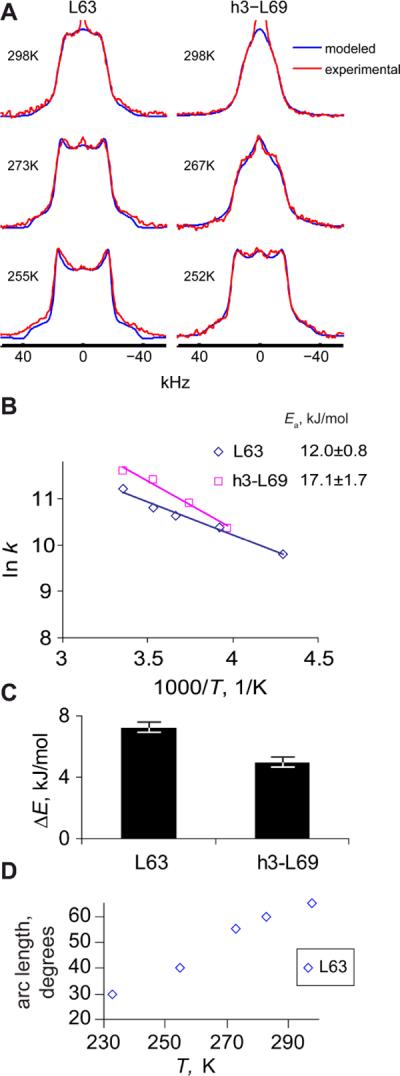
(A) Representative experimental (red) and simulated (blue) quadrupole echo line shapes for solvent-exposed methyl groups in hydrated samples. B) Fitted rotameric rate constants and activation energies. Error estimates for individual rate constants are within the size of the symbols. C) Energy difference between the major and minor forms of rotamers. D) Temperature dependence of the arc length for the restricted diffusion mode.