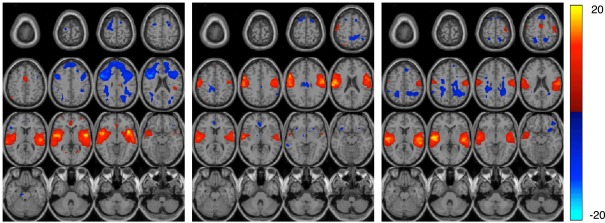
Figure 6.
The figure shows three estimated components in the rest data set. Each component is entered into a one-sample t-test and thresholded at P < 0.01 (corrected for multiple comparisons using FWE) shown with 16 slices. The left and middle components are the estimated temporal and motor-temporal components in the control group, respectively. The right component is the only temporal related component estimated in patients.

