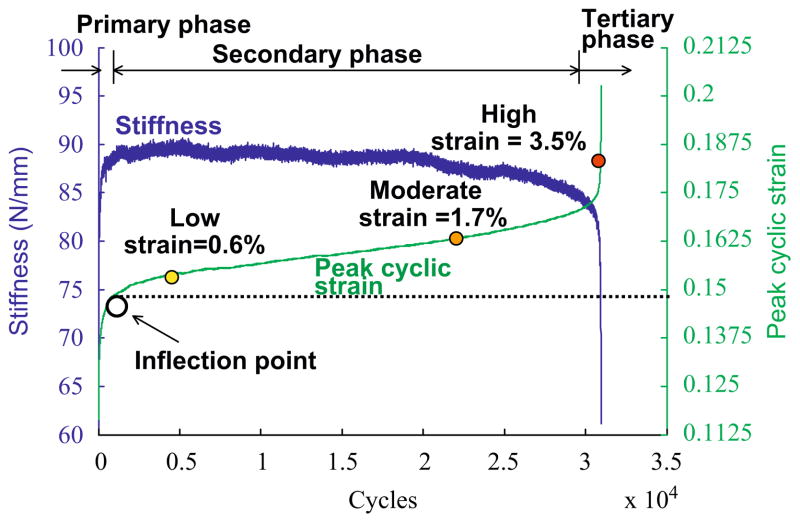
Fig. 3.
Representative loading history. Stiffness and peak cyclic strain follow different triphasic patterns during the tendon fatigue life. Stiffness increases rapidly in the Primary phase, reaches a relatively constant level in the Secondary phase, leading to an accelerating rate of decline in the Tertiary phase. In contrast, peak cyclic strain increases rapidly in the Primary phase, reaching a slow and steady rate of increase in the Secondary phase, followed by an accelerated rate of increase in the Tertiary phase. Fatigue damage levels are set at 0.6% (Low), 1.7% (Moderate) and 3.5% (High) strain increase from initial measurement determined at cycle 500, which occurs beyond the inflection point, the transition between the Primary and Secondary phase.

