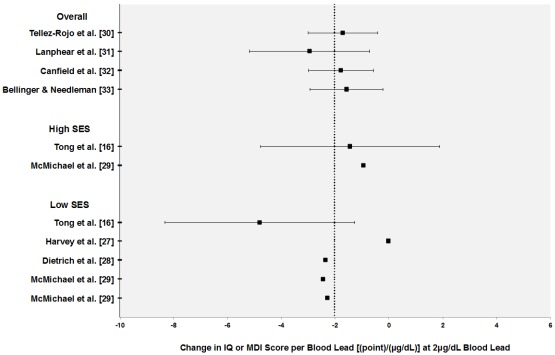
Figure 1.
Concentration-response (CR) functions for neurocognitive outcomes in children (intelligence quotient and mental development index) grouped according to socioeconomic status. CR functions are calculated at 2 µg/dL blood lead level. Error bars represent 95% confidence intervals. Vertical dotted line represents mean CR estimates across studies.

