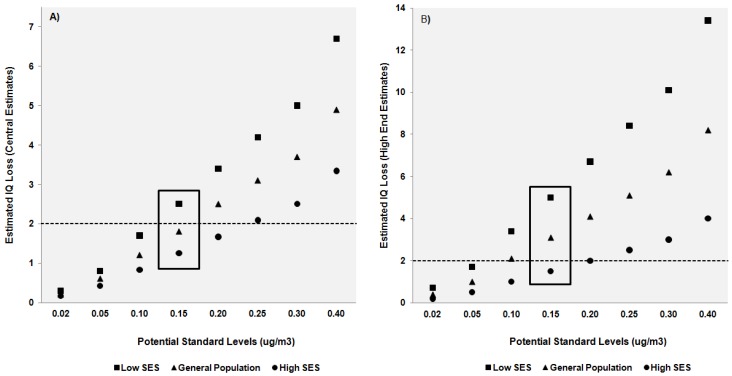
Figure 2.
Comparison of IQ loss estimates derived from general population and susceptible groups for two scenarios: (A) central estimates derived from median concentration-response (CR) functions; and (B) high-end estimates generated from the largest available CR function in each population (see Table 3). Differences across population groups are grouped according to potential standard level. Dotted line at 2 IQ points represents the acceptable risk level defined by EPA. A box surrounds estimates associated with the final standard.

