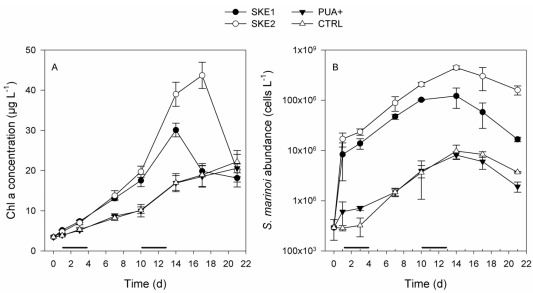
Figure 1.
Development of (A) total chlorophyll a concentration and (B) the cell abundance of Skeletonema marinoi during the time course of the experiment. SKE 1 and SKE2 were inoculated with two different S. marinoi strains at day 0. The black lines on top of the time axis indicate the first (low PUA concentration) and second (high PUA concentration) PUA addition to the PUA+ treatment.

