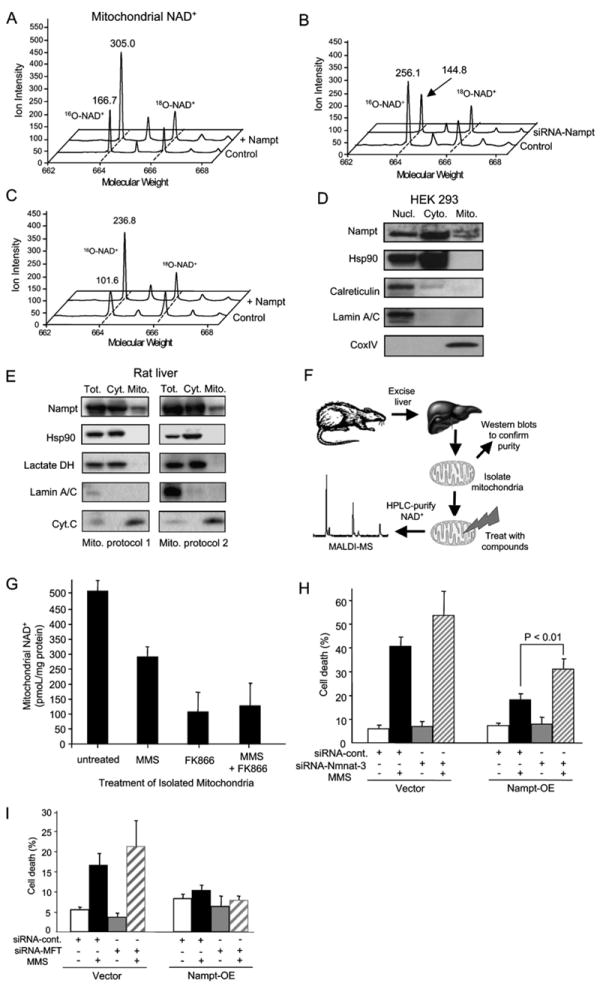
Figure 5. Mammalian Mitochondria Maintain Mitochondrial NAD+ Levels during Genotoxic Stress.

(A and B) Nampt regulates mitochondrial NAD+ levels. Mitochondrial NAD+ was isolated and analyzed as described in Figures 4B and 4C. Spectra from HEK293 are shown for vector controls and cells stably overexpressing Nampt (A), as well as spectra from HT1080 vector controls and siRNA-Nampt stable cells (B).
(C) Additional Nampt greatly attenuates mitochondrial NAD+ depletion by MMS treatment, as determined by MALDI-MS after 2 hr MMS treatment of HEK293 WT and Nampt-overexpressing cells.
(D and E) Western blotting analysis of Nampt in highly purified cytosolic and mitochondrial fractions. Mitochondiral fractions were isolated from HEK293 cells or from rat livers using two different protocols, and their purity was assessed by probing for Hsp90, calreticulin, and/or lactate dehydrogenase (exclusively cytoplasmic proteins), and CoxIV or cytochrome C (mitochondrial matrix markers). The same blot was probed for lamin A/C to test for contamination of the mitochondrial fractions with nuclei. The experiment was performed three times on HEK293 cells and on liver tissue. The same pattern was observed each time and representative blots are shown.
(F) Mitochondria from rat livers were prepared and exposed to methylmethane sulfonate (MMS), a genotoxic DNA alkylating agent, or the Nampt inhibitor FK866, or both. NAD+ levels in isolated mitochondria were determined using MALDI-MS, as above.
(G) NAD+ levels in isolated mitochondria are reduced by exposure to MMS and FK866. Similar data were obtained using a different mitochondrial isolation protocol (see Figure S5).
(H) Knocking down expression of Nmnat-3 reduces the ability of Nampt to provide resistance to MMS.
(I) Knocking down expression of a putative human mitochondrial NAD+ transporter, hMFT, does not affect survival of Nampt-overexpressing cells treated with MMS.
Bars represent the mean of three experiments ± SD.
