Fig. 1.
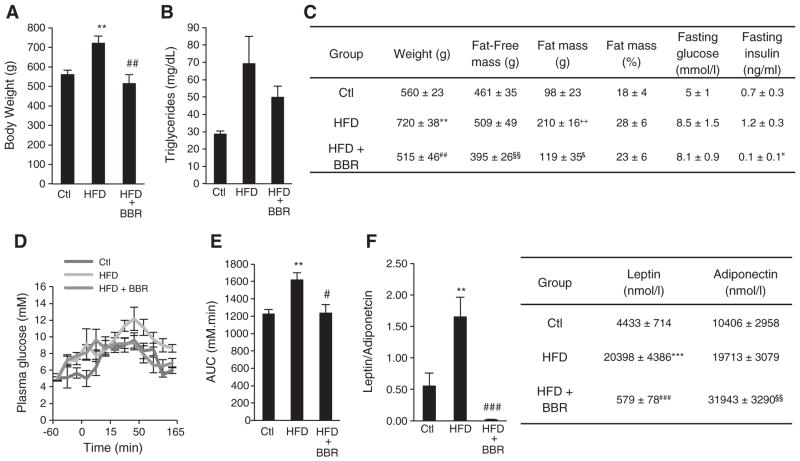
Berberine protects from obesity and obesity-induced impairment in glucose homeostasis in Sprague–Dawley Rats. (A) Body Weight of rats fed with Chow diet (Ctl), High Fat Diet (HFD) and High Fat Diet supplemented with BBR (HFD+BRR) (n=5 experiments **p<0.01 versus Ctl, ## p<0.01 versus HFD). (B) Triglycerides content expressed in mg/dL in skeletal muscle of rats fed with Chow diet (Ctl), High Fat Diet (HFD) and High Fat Diet supplemented with BBR (HFD+BRR) (n=4 experiments p≥0.05). (C) Comparative whole body characteristics of rats fed with Chow diet (Ctl), High Fat Diet (HFD) and High Fat Diet supplemented with BBR (HFD+BRR) (n=5 experiments **p<0.01 versus Ctl, ## p<0.01 versus HFD, §§ p<0.01 versus HFD, ++ p<0.01 versus Ctl, & p<0.05 versus HFD, p<0.05 versus HFD). (D and E) Plasma glucose concentrations at the indicated time points after glucose challenge were measured (D) and values for areas under the insulin curve were calculated (E) in rats fed with Chow diet (Ctl), High Fat Diet (HFD) and High Fat Diet supplemented with BBR (HFD+BRR) (n=5 experiments **p<0.01 versus Ctl, # p<0.05 versus HFD). (F) Leptin and Adiponectin content in the plasma of rats fed with Chow diet (Ctl), High Fat Diet (HFD) and High Fat Diet supplemented with BBR (HFD+BRR). (n=4 experiments **p<0.01 ***p<0.001 versus Ctl, ### p<0.001 versus HFD &&& p<0.001 versus HFD). All data represent mean±SEM.

