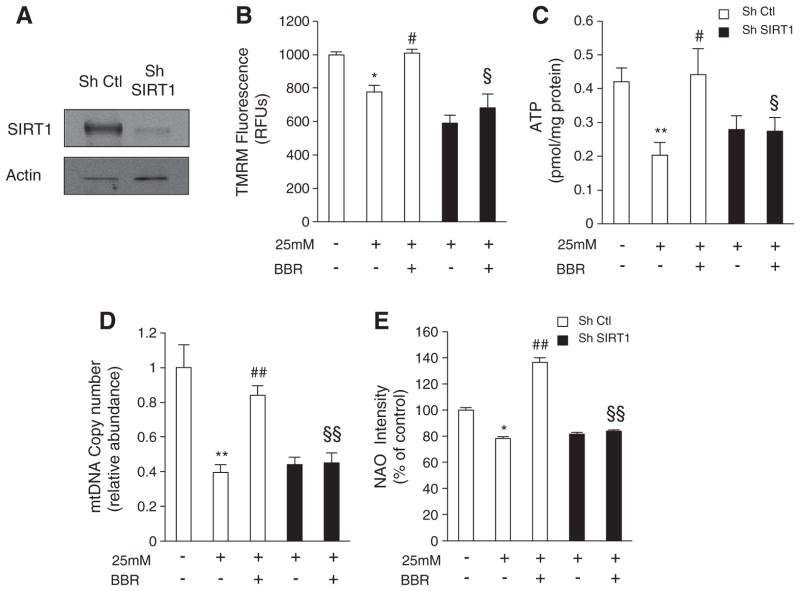
Fig. 4.
Berberine rescues mitochondrial dysfunction and mitochondrial biogenesis induced by hyperglycemia in a SIRT1-dependent manner in C2C12 myoblasts. (A) Representative Immunoblot for SIRT1 and Actin in C2C12 cells infected with SIRT1 Sh RNA (Sh SIRT1) or non targeting Sh RNA (Sh Ctl). (B and C) Mitochondrial membrane potential measured with TMRM fluorescent probe (B) and ATP content (C) measured in C2C12 cells infected with SIRT1 shRNA (Sh SIRT1) or nontargeting shRNA (Sh Ctl) after 96 h of treatment with hyperglycemia (25 mM) and 5 μM BBR. (n=5 experiments *p<0.05 **p<0.01 versus Ctl, # p<0.05 versus 25 mM, § p<0.05 versus 25 mM+BBR). (D) Mitochondrial DNA amount analyzed by means of quantitative PCR in C2C12 cells infected with SIRT1 shRNA (Sh SIRT1) or nontargeting shRNA (sh Ctl) after 96 h of treatment with hyperglycemia (25 mM) and 5 μM BBR. Relative units are expressed in comparison to untreated cells taken as 1.0. (n=5 experiments **p<0.01 versus Ctl, ## p<0.01 versus 25 mM, §§ p<0.01 versus 25 mM+BBR). (E) Mitochondrial mass measured by quantification of NAO intensity in C2C12 cells infected with SIRT1 shRNA (Sh SIRT1) or nontargeting shRNA (sh Ctl) after 96 h of treatment with hyperglycemia (25 mM) and 5 μM BBR. Data is expressed as percentage of untreated cells taken as 100% (n=5 experiments *p<0.05 versus Ctl, ## p<0.01 versus 25 mM, §§ p<0.01 versus 25 mM+BBR). All data represent mean±SEM.

