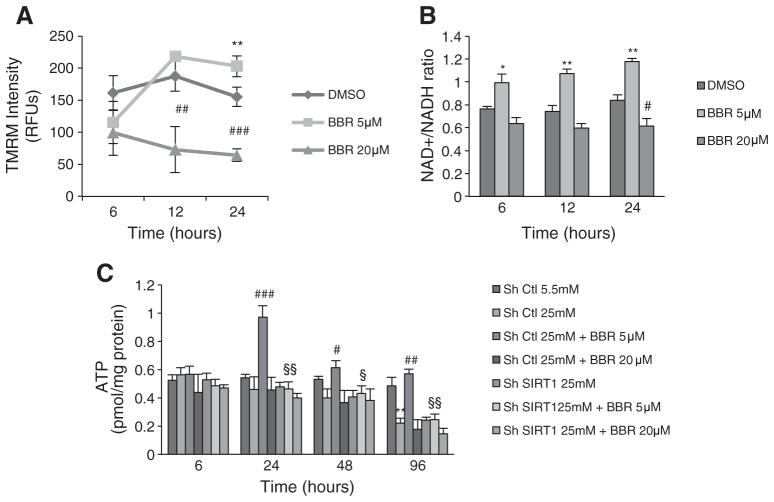
Fig. 8.
Different concentrations of Berberine have different effects in mitochondrial function in C2C12. (A) Mitochondrial membrane potential measured with TMRM fluorescent probe (B) and NAD+/NADH ratio measured spectophotometricaly in C2C12 cells after 6 h, 12 h and 24 h of treatment with 5 μM and 20 μM BBR. (n=4 experiments *p<0.05 **p<0.01 versus DMSO, # p<0.05 ## p<0.01 ### p<0.001 versus DMSO). (C) ATP content measured in C2C12 cells infected with SIRT1 shRNA (Sh SIRT1) or nontargeting shRNA (sh Ctl) after 6 h, 24 h, 48 h and 96 h of treatment with hyperglycemia (25 mM), 5 μM and 20 μM BBR. (n=4 experiments **p<0.01 versus Ctl, # p<0.05 ## p<0.01 ### p<0.001 versus 25 mM, § p<0.05 §§ p<0.01 versus 25 mM+BBR). All data represent mean±SEM.

