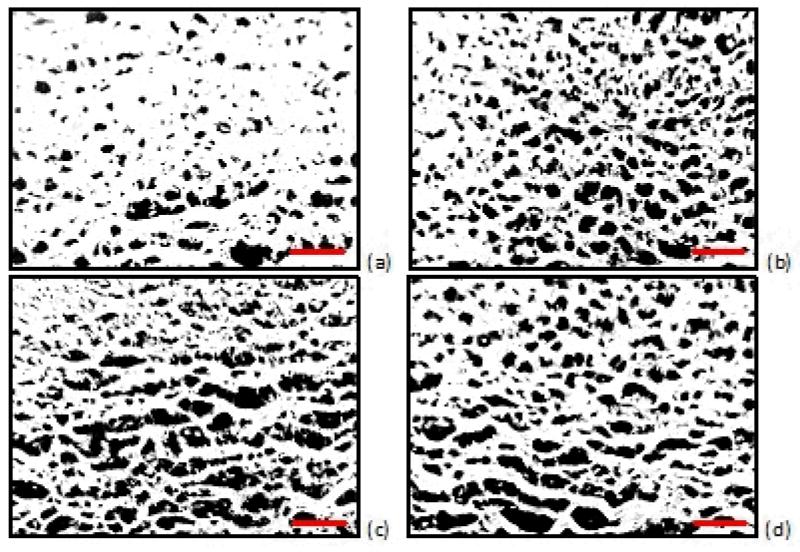
Figure 5.
Histology images of porcine aorta (which has been cut longitudinally and laid flat to facilitate harvesting tissue discs). The photographs represent predominantly medial layer for (a) day 3, (b) day 5, (c) day 7, and (d) day 9 of tissue maintained at 4°C. Sections (10 μm) were stained with hematoxylin and eosin (H&E). Histology images were converted to 8-bit grayscale images and the threshold was decreased so that the image background (pores) was rendered black. The ratio of pore area to total area tissue was calculated by averaging the pore area (shown in black) of three sections within each image (10x). Scale bars: 100μm.

