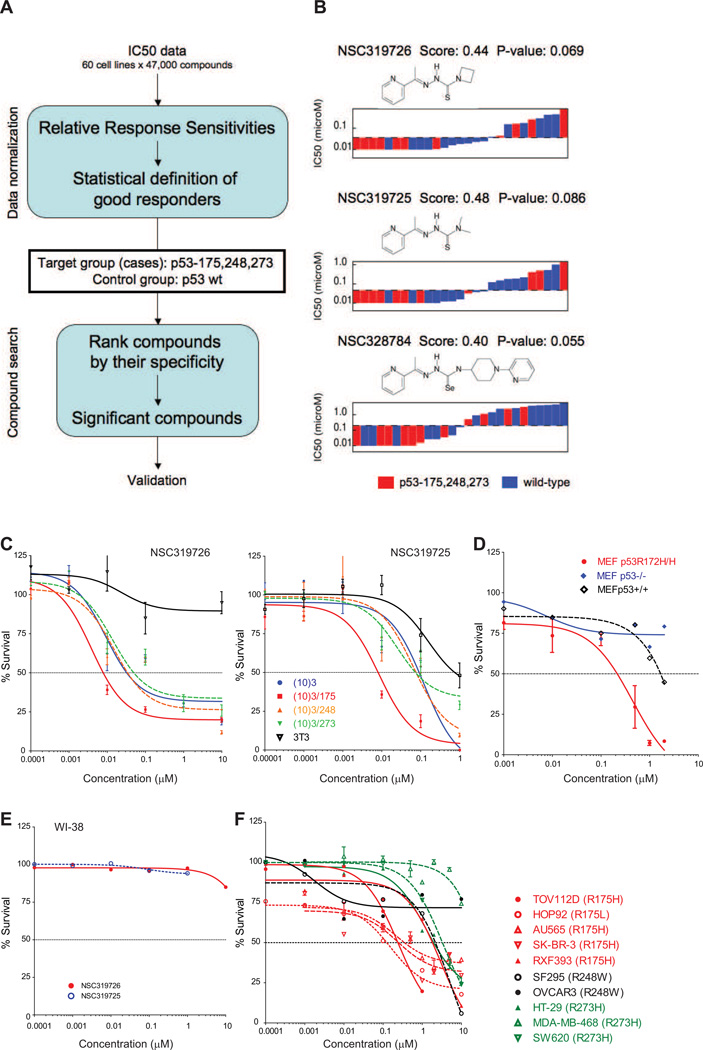
Figure 1. Identification of thiosemicarbazones with activity in cell lines expressing mutant p53.
(A) Flow-diagram of the in silico screen methodology. (B) IC50 distribution and chemical structure of the thiosemicarbazones aligning lower IC50s to higher IC50s in cells with mutant p53 (red) and WT p53 (blue), analyzed with the NCI60 dataset. In the NCI60 dataset, the human tumor cell lines are treated with 5 serial dilutions of each compound for 48 hours at 37°C. (C) Validation of the sensitivity of the compounds in the cell lines expressing mutant p53. Cell growth inhibition assays using a mouse embryonic fibroblast (MEF) cell line system consisting of (10)3 (p53−/−), (10)3/175, (10)3/248, (10)3/273 and 3T3 (p53+/+). Left panel: Growth inhibition with NSC319726. Right panel: Growth inhibition with NSC319725. (D) Sensitivity to NSC319726 in a set of isogenic MEF cell lines from p53+/+, p53−/− and p53R172H/R172H mice. (E) NSC319725 and NSC319726 do not inhibit cell growth of WI38 (p53+/+) human fibroblasts. (F) The sensitivity of NSC319726 in human tumor cell lines with hotspot p53 mutations. Cell growth inhibition was analyzed by MTS assay (C) or by Guava ViaCount assay (D, E, F). In both the MTS and Guava ViaCount assays, cells were treated with five serial dilutions of the compounds (0.00001 µM to 10 µM) for 3 days. The error bars are +/− SD. See also Figure S1.

