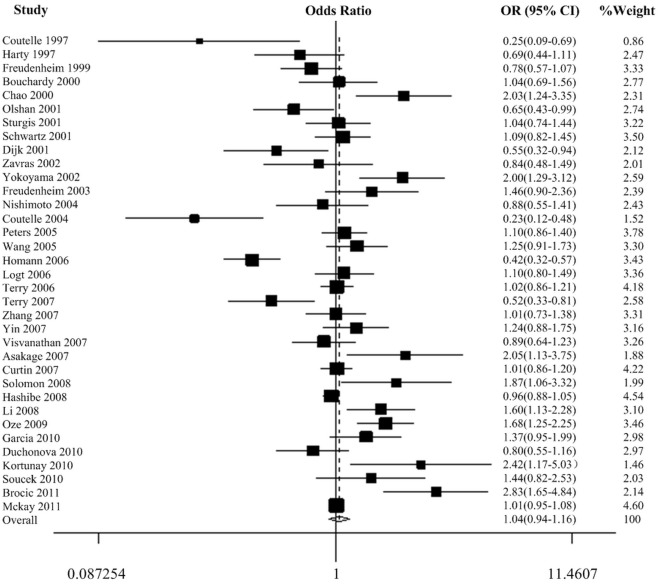
Figure 2. Forest plot of cancer risk associated with the ADH1C Ile350Val polymorphism (dominant model).
The squares and horizontal lines correspond to the study-specific OR and 95% CI. The area of the squares reflects the weight (inverse of the variance). The diamond represents the summary OR and 95% CI.

