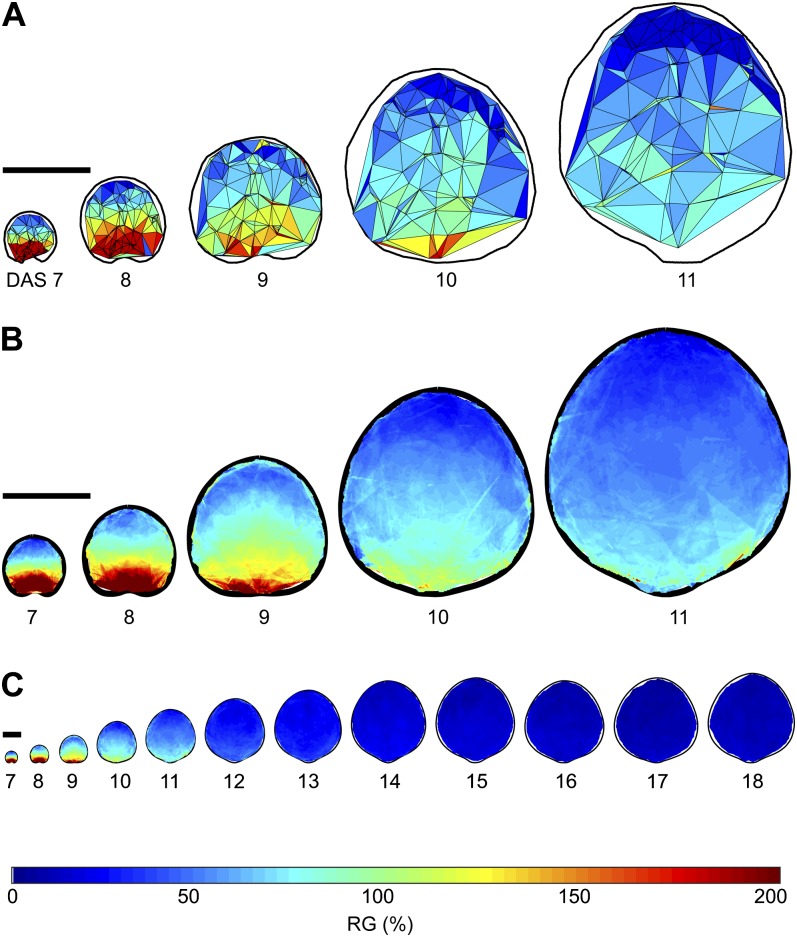
Figure 2.
Spatial maps of RGs over time. A, Spatial maps of RG for one leaf for DAS7 to DAS11. The color of each triangle indicates the percentage increase in area over the course of 1 d, according to the color scale below. B, Mean spatial maps of RG for DAS7 to DAS11 based on the average of 12 to 23 samples per time point. C, Mean spatial maps of RG for all time points quantified in this study, DAS7 to DAS18. Bars = 1 mm. For more information, see Supplemental Figure S2.

