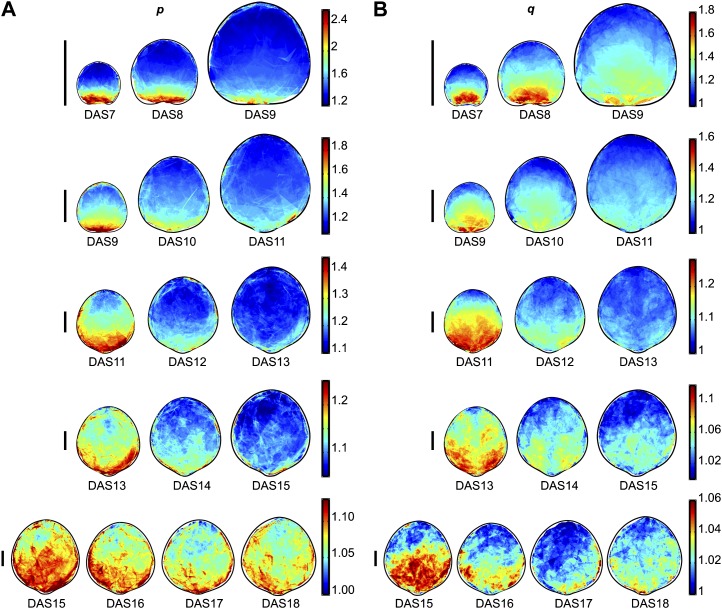
Figure 6.
Mean spatial maps of scaling factors p (A) and q (B), representing growth along the maximal and minimal directions of growth, respectively. The time points are divided into groups of 3 to 4 d (with each group overlapping the previous group by 1 d), each shown on a different line on a different color scale (right) so that the spatial and temporal patterns can be seen clearly. The maps are scaled to the relative mean leaf sizes for each DAS, and the bars on the left = 1 mm. Color scales indicate the scaling factor along the maximal (A) or minimal (B) direction of growth over the course of a 1-d interval. For more information, see Supplemental Figure S3.

