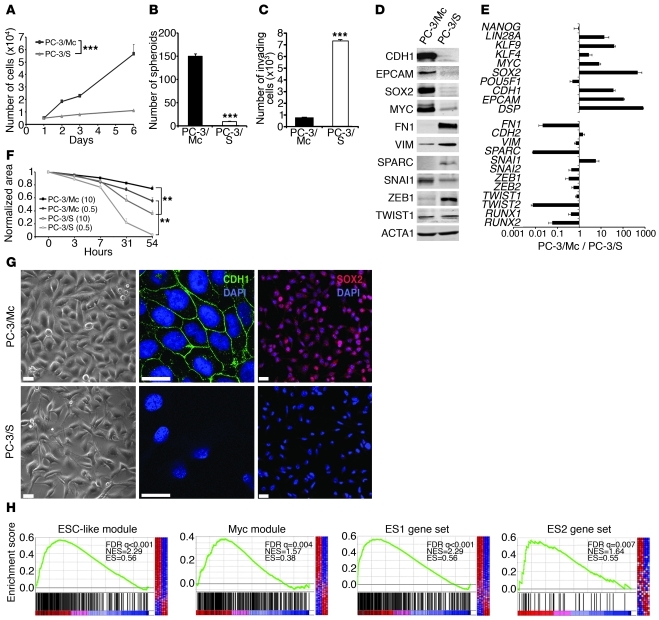
Figure 2. Opposing phenotypes and distinct gene programs expressed by 2 clonal populations derived from PC-3 cells.
(A) PC-3/Mc cells grew with short doubling times (22–24 hours), while PC-3/S cells grew with long doubling times (60–72 hours). (B) PC-3/Mc, but not PC-3/S, cells displayed robust anchorage-independent growth. Cells (103) seeded in low-attachment plates in the presence of 0.5% methyl cellulose were scored for spheroids after 14 days (triplicate assays). (C) PC-3/Mc cells were barely invasive, while PC-3/S cells were highly invasive. Cells seeded on the upper chamber of Matrigel- and hyaluronic acid–coated Transwell units were scored for invading cells after 24 hours (triplicate assays). (D) PC-3/Mc cells expressed higher levels than PC-3/S cells of E-cadherin and EpCAM. PC-3/S cells expressed higher levels than PC-3/Mc cells of fibronectin, vimentin, and SPARC, by Western blotting. (E) PC-3/Mc cells expressed higher levels than PC-3/S cells of genes associated with self renewal and pluripotency. PC-3/S cells expressed higher levels than PC-3/Mc cells of genes associated with mesenchymal phenotypes and EMT. Relative transcript levels are represented as the log10 of ratios between the 2 cell lines of their 2–ΔΔCp real-time PCR values. (F) PC-3/S cells were more motile than PC-3/Mc cells in wound-healing assays (triplicate assays). Parentheses denote percentages of FBS. (G) PC-3/Mc cells were round and expressed membrane-associated E-cadherin and nuclear SOX2. PC-3/S cells were flat and spindled and with undetectable E-cadherin. Scale bar: 20 μm. (H) Gene-set enrichment analysis (GSEA) showing significant enrichment in PC-3/Mc cells of the ESC-like, MYC, ES1, and ES2 gene modules. FDR q, false discovery rate q value; NES, normalized enrichment score; ES, enrichment score. Results are expressed as mean ± SEM. **P < 0.01; ***P < 0.001.

