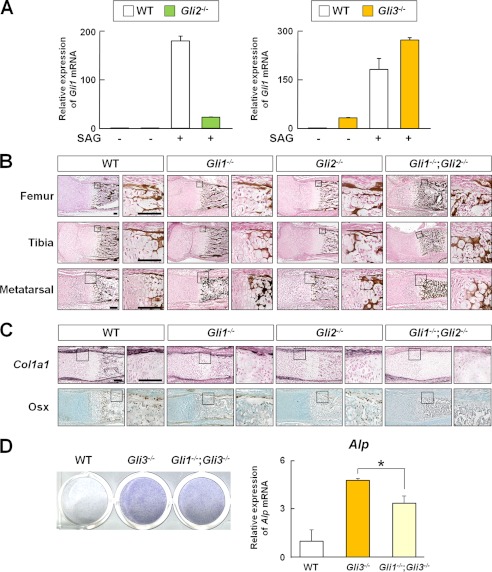
FIGURE 7.
Relationship between Gli1, Gli2, Gli3, and Hh input in osteogenesis. A, Gli1 mRNA expression determined by real-time RT-PCR in perichondrial cells from three pairs of WT, Gli2−/−, and Gli3−/− mouse embryos (E17.5). Cells were treated with SAG (1 μm) for 3 days. B, von Kossa staining of the representative sections of femurs, tibias, and metatarsals obtained from two pairs of WT, Gli1−/−, Gli2−/−, and Gli1−/−;Gli2−/− newborn mice. Scale bars = 100 μm. C, in situ hybridization (Col1a1) and immunohistochemistry (Osx) of the representative sections of metatarsals obtained from two pairs of WT, Gli1−/−, Gli2−/−, and Gli1−/−;Gli2−/− newborn mice. Scale bars = 100 μm. D, ALP staining and Alp mRNA expression determined by real-time RT-PCR in perichondrial cells from three pairs of WT, Gli3−/−, and Gli1−/−;Gli3−/− mouse embryos (E17.5). Cells were treated with SAG for 7 days for ALP staining and for 3 days for real-time RT-PCR analysis. *, p < 0.05. For A and C, data are means ± S.D. of triplicate wells, and representative data of independent experiments are shown.

