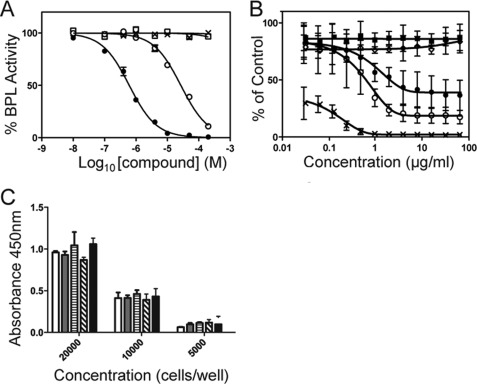
FIGURE 4.
Biological assays. A, differential inhibition is shown. BPL activity was measured in vitro with varying concentrations of 14. The assays were performed using recombinant BPL from S. aureus (●), E. coli (□), and H. sapiens (×). The mutant Arg-125→Asn was also included (○). B, anti-Staphylococcus activity is shown. Inhibition of the growth of S. aureus ATCC 49775 was measured using a microbroth dilution assay with varying concentrations of 2 (○), 13 (◊) and 14 (●). No inhibitor (■) and erythromycin (×) served as negative and positive controls, respectively. C, the cytotoxicity of the biotin triazole series was assessed on HepG2 cells using an assay for metabolic activity. Cells were seeded at either 20,000, 10,000, or 5,000 cells per well and treated for 48 h with media containing 64 μg/ml of compound and 4% (v/v) DMSO. The treatments in this series were the DMSO vehicle control (white bar), 5 (gray bar), 7 (horizontal stripe), 13 (diagonal stripe), and 14 (black bar).

