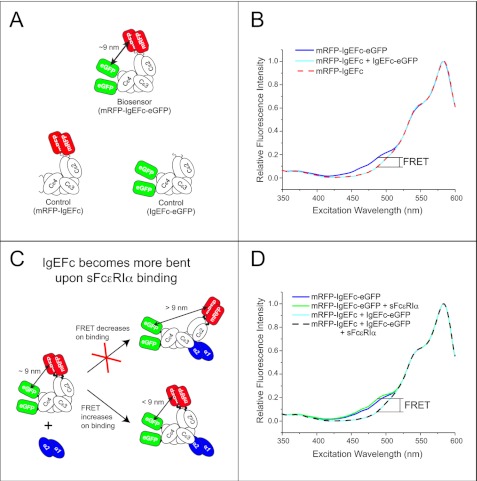
FIGURE 1.
The mRFP-IgEFc-eGFP biosensor reveals IgEFc to be bent in solution and to undergo conformational change on binding to sFcϵRIα. A, schematics of the three fluorescent constructs are shown. B, shown is a steady-state fluorescence excitation scan (emission detected at 610 nm) of either the FRET biosensor mRFP-IgEFc-eGFP (blue line) or control molecules mRFP-IgEFc alone (red dashed line) or with IgEFc-eGFP (cyan line). The increase in fluorescence shown here is indicative of energy transfer. C, shown is a schematic of the proposed conformational change model to be tested using the mRFP-IgEFc-eGFP biosensor. D, shown is a steady-state fluorescence excitation scan (emission detected at 610 nm) of either the FRET biosensor mRFP-IgEFc-eGFP alone (blue line) or saturated with sFcϵRIα (green line) or control molecules mRFP-IgEFc and IgEFc-eGFP alone (cyan line) or with sFcϵRIα (black dashed line). The fluorescence increases when sFcϵRIα binds to the mRFP-IgEFc-GFP biosensor indicative of additional bending within IgEFc.

