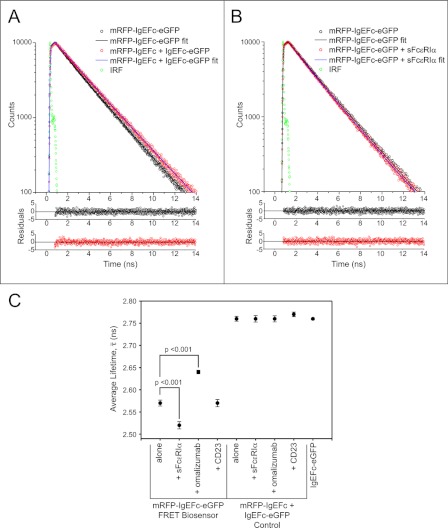
FIGURE 2.
Fluorescence lifetime measurements for biosensor and control molecules in the presence and absence of IgE ligands. A, shown are fluorescence decays (excitation 468 nm, emission 510 nm) and bi-exponential fits (line plots) and their photon-counting weighted residuals for the mRFP-IgEFc-eGFP biosensor (open black circles) or control molecules (open red circles). Green circles are the instrument response function (IRF). Non-overlap of the fits indicates a shorter fluorescence lifetime for the mRFP-IgEFc-eGFP biosensor and that it is, therefore, undergoing FRET. B, shown are fluorescence decays (excitation 468 nm, emission 510 nm) and bi-exponential fits (line plots) and their photon-counting weighted residuals for the mRFP-IgEFc-eGFP biosensor alone (open black circles) or saturated with sFcϵRIα (open red circles). Green circles are the instrument response function. Non-overlap of the fits indicates a shorter fluorescence lifetime for the mRFP-IgEFc-eGFP biosensor in the presence of sFcϵRIα. C, shown is mean values of the results of independent experiments (n = 5) for the true average lifetimes (¯τ) calculated using Equation 2. Significant values were determined using a one-way analysis of variance with the Tukey-Kramer test. Only the biosensor mRFP-IgEFc-eGFP shows FRET, with changes in true average lifetimes on binding to both sFcϵRIα and omalizumab Fab.

