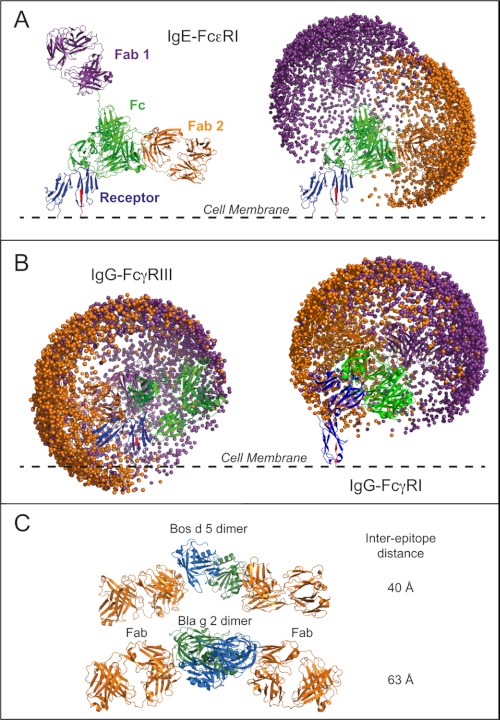
FIGURE 4.
Molecular modeling of the space occupied by Fab arms in whole IgE and IgG. Example models of whole IgE (A) and IgG (B) are overlaid with their respective receptor complexes (see also supplemental video). The receptor α-chains are shown in blue with the C-terminal β-strand leading into the cell membrane in red. Fc domains are shown in green, and the Fabs are in purple and orange. Plots showing the spatial distributions of the Fab paratope residue Arg-101 are shown for 2000 models. C, shown is the arrangement of Fabs and allergen dimer in the Fab-allergen-allergen-Fab crystal structures for Bos d 5 (PDB code 2R56 (46)) and Bla g 2 (PDB code 2NR6 (67)). Images of the structures were produced using PyMOL (68).

