FIGURE 6.
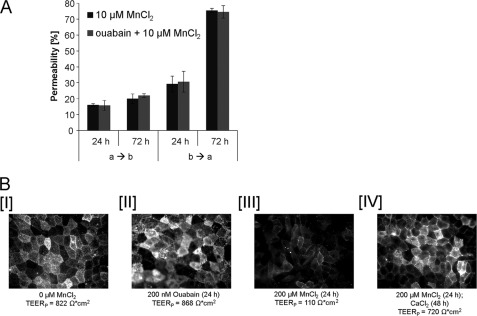
Mn transfer across the in vitro blood-CSF barrier without/with the Na+,K+-ATPase-inhibitor ouabain (200 nm). A, mean values of three determinations ± S.D. (error bars). B, immunocytochemical staining of the Na+,K+-ATPase. I, nontreated (TEERP = 822 ohms*cm2) barriers; II, barriers after basolateral incubation with 200 nm ouabain for 72 h (TEERP = 868 ohms*cm2); III, barriers after basolateral incubation with 200 μm MnCl2 for 24 h (TEERP = 110 ohms*cm2); and IV, barriers after 24-h basolateral preincubation with MnCl2 and 48 h after incubation with Ca-enriched SFM (SFM + 250 μm CaCl2 (TEERP = 720 ohms*cm2). a → b, apical-to-basolateral transfer; b → a, basolateral-to-apical transfer.

