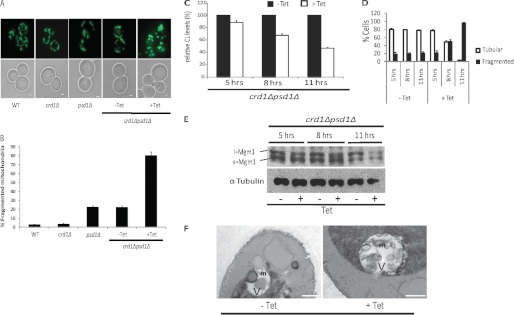
FIGURE 2.
Mitochondrial fragmentation observed in crd1Δpsd1Δ cells. A, mitochondria were visualized using mtGFP. Cells were grown at 30° C to log phase in synthetic leucine deficient medium with or without 200 μg/ml tetracycline (Tet) and examined by fluorescence microscopy. Bars, 1 μm. B, quantitation of cells containing fragmented mitochondria. Values are mean ± S.E. (n = 3). At least 500 cells were visualized in each experiment. C–F, the crd1Δpsd1Δ mutant cells were grown at 30° C in the presence or absence of 200 μg/ml tetracycline and harvested at the indicated times. C, CL levels were analyzed by one-dimensional TLC as described under “Experimental Procedures,” and relative levels of CL are indicated. Values are mean ± S.E. (n = 3). D, cells containing fragmented and tubular mitochondrial morphology were quantified. Values are mean ± S.E. (n = 3). E, total cell proteins were extracted and analyzed by SDS-PAGE followed by Western blot. F, aliquots of crd1Δpsd1Δ cells were fixed as described under “Experimental Procedures,” and thin sections were examined by electron microscopy. Labels m and V indicate mitochondria and vacuole (white area), respectively. Bars, 500 nm.

