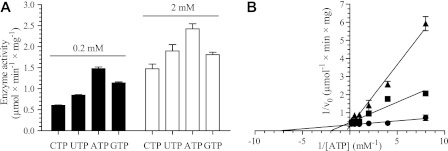
FIGURE 5.
Effects of NTPs and dTTP on T. brucei TK activity. A, enzyme activities with 50 μm thymidine as substrate and different phosphate donors used at 0.2 and 2 mm concentrations. B, Lineweaver-Burk diagram of TK activity with 50 μm thymidine and varying concentration of ATP in the absence (●) or presence of 25 μm (■) or 50 μm dTTP (▴). All experiments were performed in duplicate, with the S.D. values shown by error bars.

