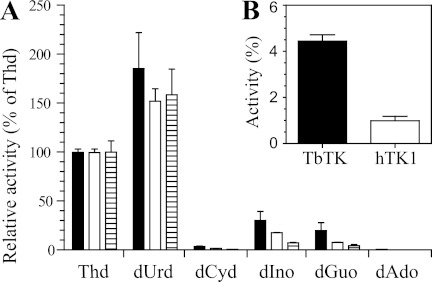
FIGURE 6.
Substrate selectivity of T. brucei TK (black bars), human TK1 (white bars), and T. brucei TK domain 2 (hatched bars). Experiments were performed with 10 mm deoxynucleosides (A) or 0.5 mm deoxyinosine (B). Enzyme activities are shown as a percentage of the activity observed with 10 mm thymidine. All experiments were performed in duplicate, with the S.D. values shown by error bars.

