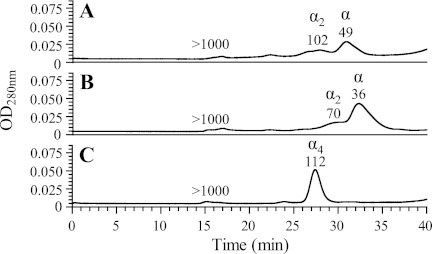
FIGURE 7.
Gel filtration analyses of full-length T. brucei TK (A), domain 2 (B), and human TK1 (C). Molecular masses shown above each peak are estimated by comparing the retention times with a standard curve (supplemental Fig. S6). Late eluting peaks (tR > 40 min) from compounds smaller than 1 kDa are not included in the chromatograms.

