FIGURE 6.
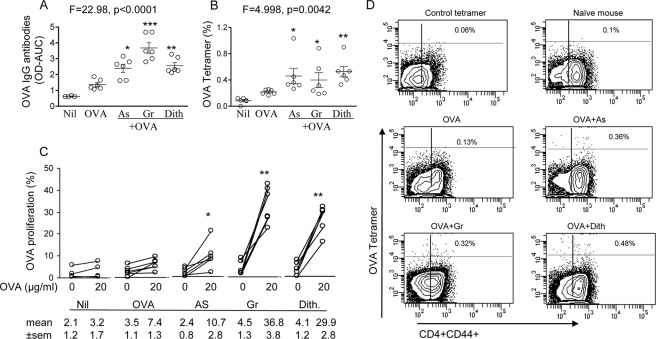
Serum IgG antibodies to OVA (A), induction of OVA-specific CD4+ T cells (B), representative flow cytometry (D), and CD4+ T cell proliferative responses (C), in mice following immunization with OVA and the stress-inducing agents; the responses before and after in vitro restimulation with 20 μg/ml OVA are presented. In A and C Nil group (n = 4). *, p < 0.05; **, p < 0.01; and ***, p < 0.001.

