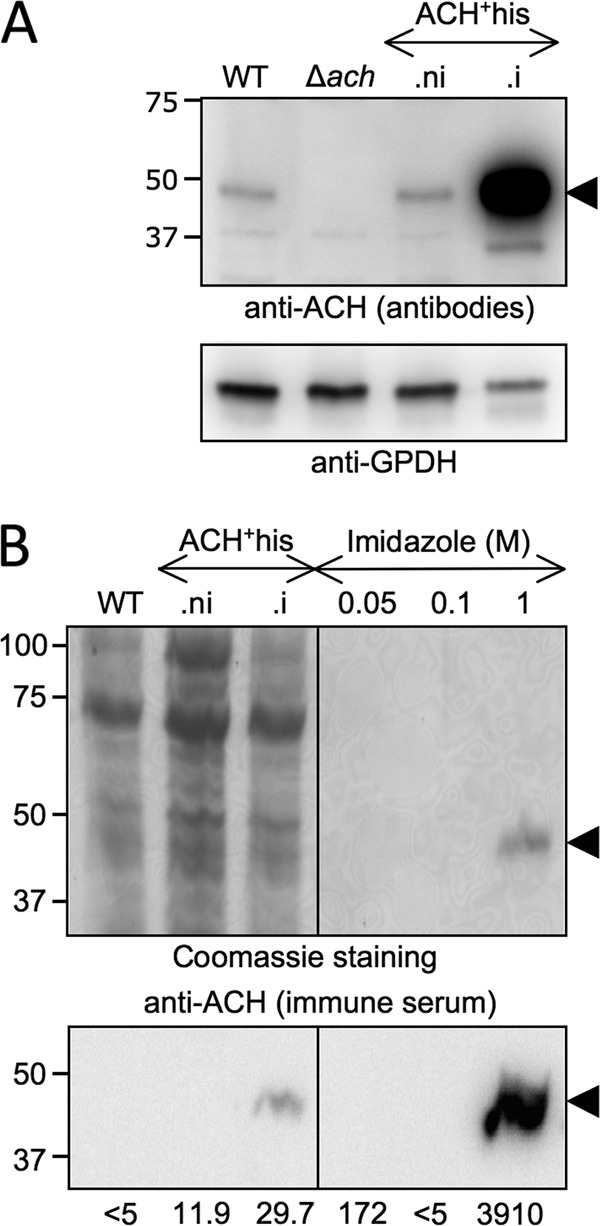
FIGURE 4.

Overexpression and purification of ACH. Lysates of T. brucei EATRO1125.T7T procyclic form (WT), Δach, non-induced (.ni), and tetracycline-induced (.i) ACH+his cell lines were analyzed by Western blotting with the immunopurified anti-ACH antibodies and the anti-glycerol-3-phosphate dehydrogenase (GPDH) immune serum (A). Samples contained 5 × 10⁶ cells, except for ACH+his.i (1.5 × 10⁶ cells). ACH overexpression in ACH+his.i was quantified using the KODAK Image Station 4000 MM. B, purification by nickel chelation of the ACH+his. Top panel, Coomassie staining of lysates (5 × 10⁶ cells) of wild type procyclic cell, non-induced, and tetracycline-induced ACH+his cell lines and elution fractions sequentially obtained by nickel chelation with different imidazole concentrations. For each elution condition (0.05, 0.1, and 1 m), only the first of the three collected fractions is shown. The bottom panel shows the corresponding Western blot with the anti-ACH immune serum. The specific acetyl-CoA thioesterase activity (milliunits/mg of protein) measured for each sample is indicated below the Western blot. The positions of the molecular weight markers are indicated in kDa on the left of each panel.
