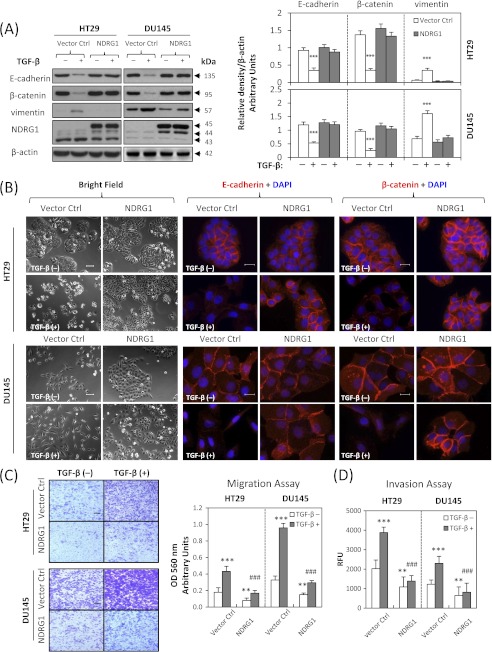
FIGURE 4.
Overexpression of NDRG1 attenuates the TGF-β-induced EMT. NDRG1 overexpressing HT29 cells (clone 2), DU145 cells (clone 7), and their empty vector control cells were treated in the presence or absence of TGF-β (5 ng/ml) for 96 h and 48 h, respectively. A, Western analysis of NDRG1 and EMT marker expression. The FLAG-tagged NDRG1 was strongly expressed in both cell types (∼45 kDa). In NDRG1-overexpressing clones, there was a marked increase in the expression of FLAG-tagged NDRG1 (at ∼45 kDa) as well as the ∼44 kDa band. Densitometric analysis is expressed relative to the loading control, β-actin. B, bright field and immunofluorescence images were taken and E-cadherin (red), β-catenin (red), and nucleus (blue) were stained as described above. Scale bars: 100 μm for bright field and 20 μm for immunofluorescence. C and D, the cell migration and invasion assays were performed as described in Fig. 2, D and E. Scale bars: 200 μm. Data were repeated for 3–5 times, and the values in histograms represent mean ± S.D. (3–5 experiments). *, relative to vector control without TGF-β; #, relative to vector control with TGF-β. **, p < 0.01; ***, p < 0.001; ###, p < 0.001.

