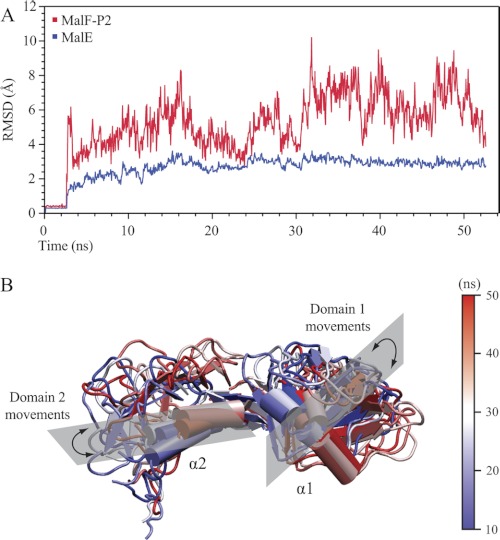
FIGURE 7.
50-ns molecular dynamics simulation of the MalE/MalF-P2 complex. A, backbone r.m.s.d. trajectory of the MalF-P2/MalE complex. The first 2.5 ns comprise a waterbox refinement before starting the simulated annealing. The backbone r.m.s.d. trajectory of MalE is represented in blue and MalF-P2 in red. MalE keeps a rigid structure with little dynamics (r.m.s.d. ∼ 3 Å) in the course of the full simulation. A much larger dynamic behavior is observed for MalF-P2 (r.m.s.d. = 4–9 Å). MalF-P2 undergoes large conformational rearrangements initially until the correct conformation with respect to MalE is found. B, representations of MalF-P2 at different time steps of the simulation. Structures are shown at every 10 ns of the simulation with colors shifting from blue to white to red. The two α-helices of MalF-P2, α1 and α2, make up the main interaction with MalE (11). During the course of the simulation they undergo large rearrangements while still maintaining the interaction to MalE.

