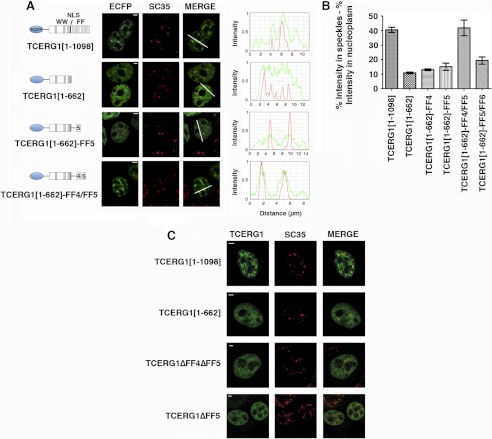
FIGURE 1.
The FF4/FF5 domains are required for efficient targeting of TCERG1 to the speckle compartment. A, dual-labeling of cells transfected with ECFP-TCERG1[1–1098] or the indicated mutant constructs (ECFP, green) with the anti-SC35 antibody (SC35, red) was performed. A diagrammatic representation of the ECFP-TCERG1 fusion proteins is shown to the left of each panel. The numbers in parentheses represent the TCERG1 amino acids contained in the construct. Shown are the three WW domains, the putative nuclear localization signal (NLS), and the six FF domains. Line scans showing local intensity distributions of TCERG1 and SC35 are shown to the right of the panels. Bars in the merged panels indicate the positions of the line scans. Scale bars, 3 μm. B, the nucleoplasmic fraction of TCERG1 proteins present in speckles was determined after measuring the fluorescence intensity in speckles relative to nucleoplasm as described under “Experimental Procedures.” The data shown are from three independent experiments. Student's t test was performed, and differences were shown to be highly significant: p(TCERG1[1–1098] versus TCERG1[1–662]) < 0.0001; p(TCERG1[1–1098] versus TCERG1[1–662]-FF4) = 0.0001; p(TCERG1[1–1098] versus TCERG1[1–662]-FF5) = 0.0011; p(TCERG1[1–1098] versus TCERG1[1–662]-FF4/FF5) = 0.8261; p(TCERG1[1–1098] versus TCERG1[1–662]-FF5/FF6) = 0.0023; p(TCERG1[1–662]-FF4/FF5 versus TCERG1[1–662]-FF4) = 0.0060; p(TCERG1[1–662]-FF4/FF5 versus TCERG1[1–662]-FF5) = 0.0106; and p(TCERG1[1–662]-FF4/FF5 versus TCERG1[1–662]-FF5/FF6) = 0.0192. The bar graph represents mean ± S.D. C, immunofluorescence analysis of cells transfected with the indicated plasmids. Images show a speckled pattern for full-length TCERG1[1–1098], but TCERG1[1–662], TCERG1[ΔFF4/FF5], and TCERG1[ΔFF5] are more diffusely dispersed throughout the nucleoplasm. Individual and merged images of the cell labeled with the indicated fluorescent proteins (FP, in green) and with the anti-SC35 antibody (SC35, red) are shown. Scale bars = 3 μm.

