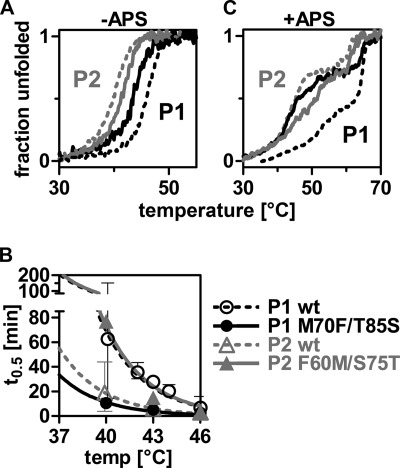
FIGURE 6.
Characterization of the Met ⇔ Phe/Thr ⇔ Ser double mutants. A, thermal unfolding transitions monitored by CD spectroscopy at 225 nm. B, loss-of-activity measurement of the APS kinase activity of wild-type and mutant proteins. C, thermal unfolding transitions in presence of 50 μm APS. The legend applies to all three graphs.

