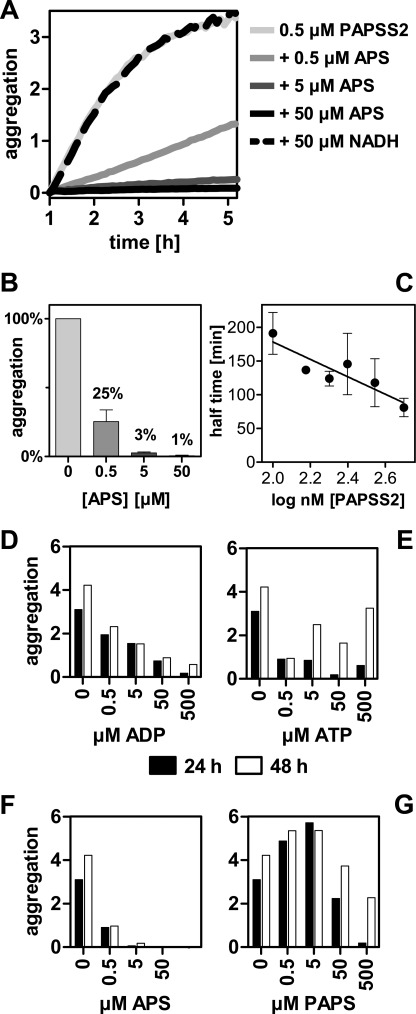
FIGURE 8.
APS specifically modifies aggregation behavior of PAPSS2. A, using the side scatter signal at 280 nm normalized by 340 nm fluorescence, aggregation was monitored for PAPSS2 in the presence of varying concentrations of APS at 37 °C. Equimolar concentrations of APS effectively prevented aggregation. The nucleotide cofactor NADH was used as negative control and showed no effect. B, point measurements for the same reactions after 24 h. Equimolar concentrations of APS reduced aggregation to 25%. Error bars represent S.D. of triplicate measurements. C, concentration dependence of the aggregation phenomenon. Aggregation of PAPSS2 was analyzed at concentrations between 100 and 500 nm. Error bars represent S.D. of duplicate measurements. D–G, at low nucleotide concentrations, prevention of aggregation of PAPSS2 was specific for APS. The other nucleotides tested (ADP, ATP, and PAPS) had less effect on preventing protein aggregation at concentrations up to 500 μm.

