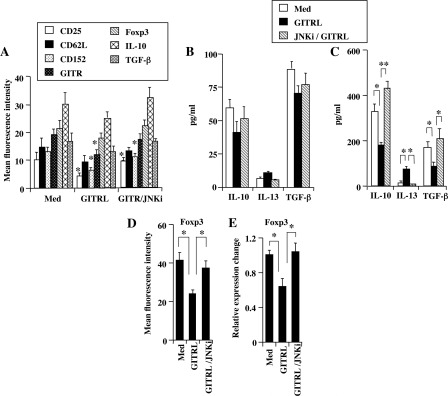
FIGURE 4.
Effect of GITR ligation on expression of surface markers, production of cytokines at different time course in the presence and absence of JNKi (50 μm), and expression of Foxp3. A, FACS analysis of nTregs following overnight GITR ligation; *, p < 0.05 compared with expression in medium control. B, cytokine levels in supernatants (overnight); C, cytokine levels in supernatants (72 h). D, expression of Foxp3 protein following GITRL stimulation (72 h). E, expression of Foxp3 mRNA following GITRL stimulation. Results are from three independent experiments carried out in duplicate. Med, medium. **, p < 0.01; *, p < 0.05.

