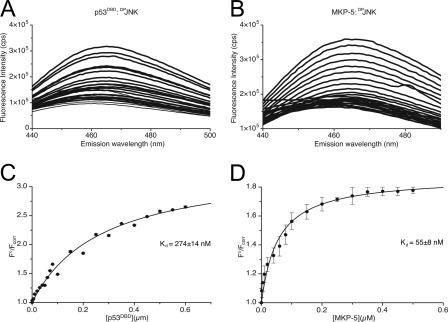
FIGURE 8.
Determination of dissociation constants for hp53DBD·DPrJNK and MKP-5·DPrJNK complexes. A, increasing concentrations of hp53DBD (0.001–0.6 μm) were added to 0.1 μm CPM-labeled DPrJNK in 1× HBS (Imax = 3.1 × 10⁵), and the fluorescence intensity was quantified at 465 nm. B, increasing concentrations of MKP-5 (0.001–0.6 μm) were added to 0.1 μm CPM-labeled DPrJNK in HBS (Imax = 3.5 × 10⁵), and the fluorescence intensity was quantified at 465 nm. C, binding data from A plotted as percentage of CPM-DPJNK bound (F°/Fcorr) versus the concentration of hp53DBD. D, binding data from B plotted as percentage of CPM-DPJNK bound (F°/Fcorr) versus the concentration of MKP-5. Data from C and D were fit to a hyperbolic function using non-linear regression, and the apparent dissociation constants were determined. Data in C and D plotted as average ± standard deviation.

