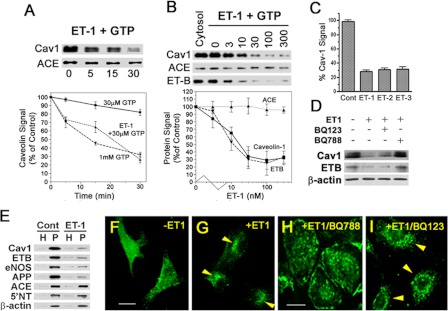
FIGURE 1.
Endothelins induce endothelial caveolae budding in vitro, in cell culture, and in situ. A–D, in vitro reconstituted cell-free budding assay (see “Experimental Procedures”). Western blot analysis of repelleted silica-coated endothelial plasma membranes showing the signal for the indicated proteins either after 100 nm ET-1 stimulation for the indicated times (A) or stimulation with indicated concentration (nm) of ET-1 for 30 min (B). The graphs represent the quantified signal from the Western blot analysis as a percentage of control signal (either ET-1 at time 0 or no ET-1, respectively) for the indicated protein and then plotted as a function of incubation time (A) or ET-1 concentration (B). C, histogram showing relative cav1 signal remaining on repelleted silica-coated endothelial plasma membranes after 30 min of treatment with of ET-1, ET-2, and ET-3. D, Western blot analysis of the repelleted silica-coated endothelial plasma membrane proteins showing the signal for the indicated primary antibodies after 30 min of pretreatment with either 50 nm BQ123 (ET-A antagonist) or 5 nm BQ788 (ET-B antagonist) followed by 30 min of stimulation with ET-1. E, Western blot analysis of silica-coated endothelial plasma membranes isolated from rat lungs showing the signal for the indicated primary antibodies after 5 min of stimulation with ET-1. F–I, confocal fluorescence microscopic images of cav1-eGFP expressing BAEC showing caveolin-1 localization either untreated (F) or after 5 min of stimulation with ET-1 (G). Confocal fluorescence microscopic images of BAEC showing localization of caveolin-1 after pretreated for 30 min with either 5 nm BQ788 (H) or 50 nm BQ123 (I) followed by 5 min of stimulation with ET-1. The arrowheads indicate cav1 perinuclear intracellular localization. H, total lung homogenate; eNOS, endothelial nitric-oxide synthase. Cont, control. All of the graphs are the percentages of the control cav1 signal detected without ET1 exposure. n ≥ 3 experiments. The bar represents 100 μm.

