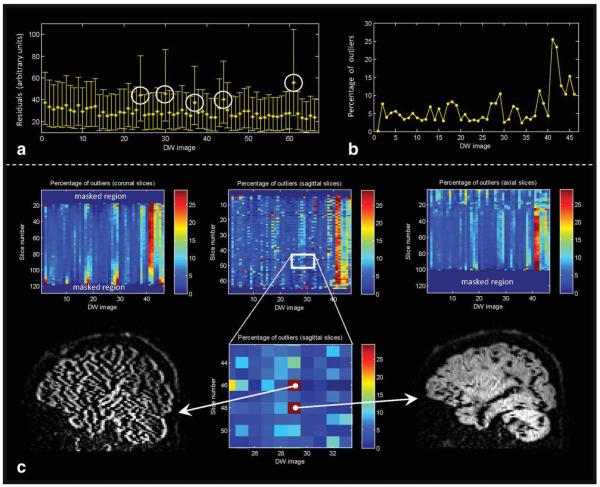
FIG. 9.
a: Diffusion tensor residuals calculated for each DW image (averaged across all brain voxels—see Eq. 3, with the error bars representing the inter-quartile range). In the example shown, five diffusion volumes were “heavily” corrupted as indicated by the higher residuals (encircled). b: A more quantitative feel of the significance of high residual values is obtained by calculating the “statistical” outliers of these tensor residuals. The percentage of outliers per DW image may then serve as a marker to identify artifacts. c: To increase the specificity of detecting artifacts, the same procedure can be applied to each slice separately and along the different (coronal, axial, and sagittal) image views. In this way, a summary statistic of data quality can be shown for each slice and for all the DW gradient directions simultaneously in a single matrix. Retrospective identification of “problematic” slices is then facilitated by the “hot spots” (see enlarged region).

