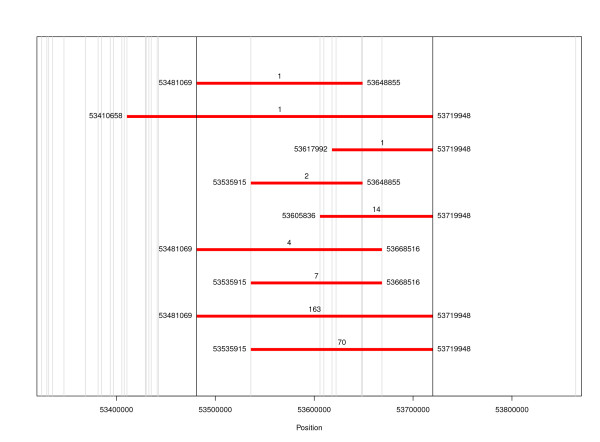
Figure 1.
Deletion variants detected in the 53 Mb region according to PennCNV. The red bars show the SNP boundaries of the deletion with their position (bp); the number of animals detected with the variants is given at the top of the red bars and the vertical lines indicate the position of the SNP relative to the map of BTAU4 [11].

