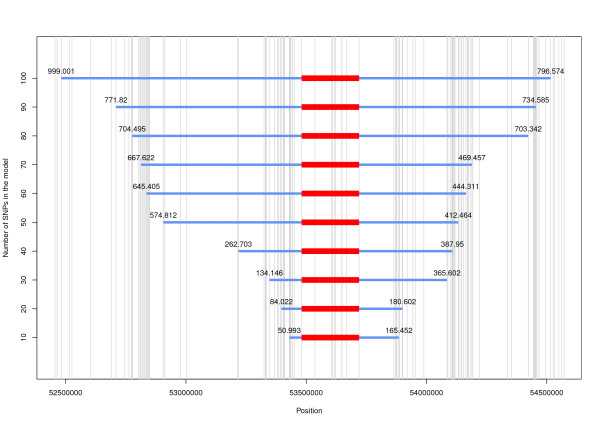
Figure 2.
Density of SNP (vertical lines) around the CNV region. The red bar is the CNV region (53,481,069-53,719,948 bp) and the blue bar represents the region encompassing the SNP in different models; the distance of the farthest SNP from the CNV boundary (the region covered by the SNP) is given in kb above the blue bar.

